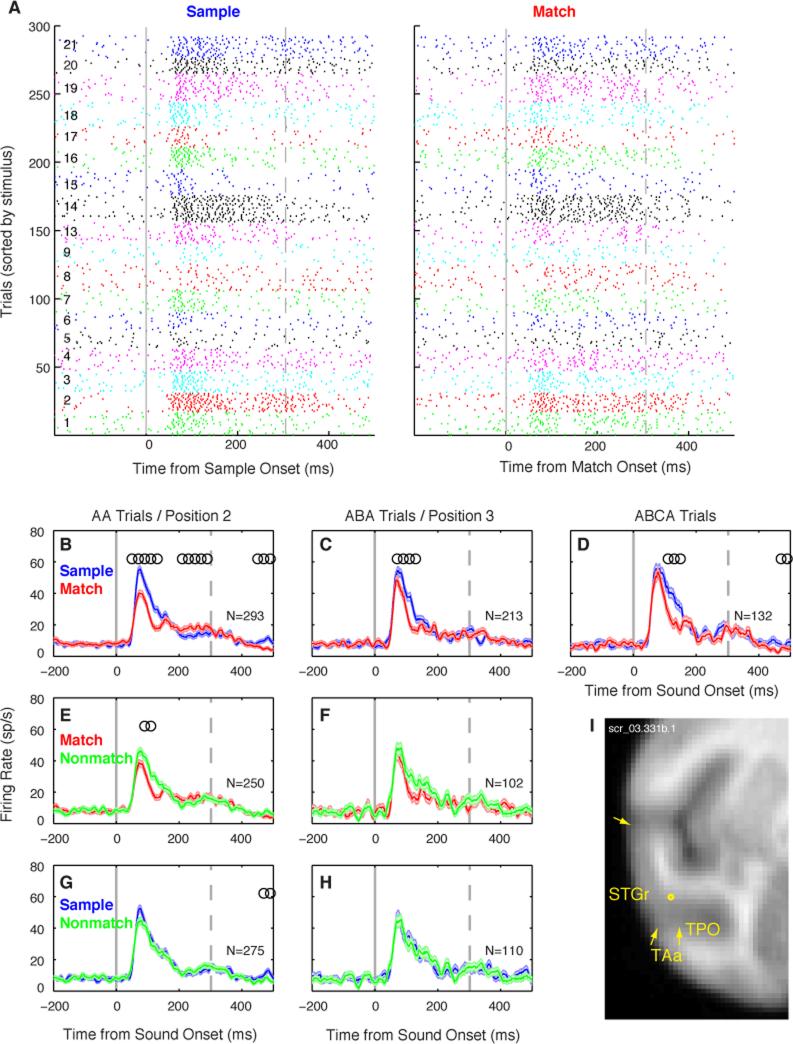
Figure 3.
Match suppression (MS) in a well-isolated single unit recorded in ventral STGr. (A) Spike-time rasters of sample and match responses across 293 correct DMS trials (AA trials only), sorted by stimulus (numbered 1-21 at left, and indicated by tick colors). Solid gray line marks stimulus onset; dashed gray line marks offset of the longest stimuli. This unit responded vigorously to complex stimuli like rippled noise (1-3), a rhesus bark vocalization (14), and environmental sounds (19-21), with an onset latency of 55 ms. (B-D) Overlay of firing rate (mean ± SEM across trials) to sample (blue) and match (red) presentations in all correct trials (N indicated in each panel). In all panels, responses to different stimuli are pooled, and the number of trials per stimulus is equal across conditions. Open circles mark the centers of 100-ms time bins with a significant difference in firing rate between conditions (Wilcoxon rank-sum, p<0.01 corrected). Match responses were suppressed relative to responses to the sample in all trial types, though the onset component ‘recovers’ on ABCA trials. (E,F) Overlay of match (red) and nonmatch (green) responses at position 2, the first stimulus to follow the sample, and at position 3, after an intervening nonmatch. This unit shows a significant match/nonmatch effect at position 2, but not at position 3. (G,H) Overlay of responses to the nonmatch (green) and the sample (blue), for a nonmatch at positions 2 and 3. No significant difference was seen, implying that suppression was specific to the match, and was not driven by a generalized suppression of responses later in the trial. (I) Recording location aligned to the MRI atlas, with the rostro-caudal position indicated in mm relative to the interaural axis. See Figure S1 for additional MS example units.

