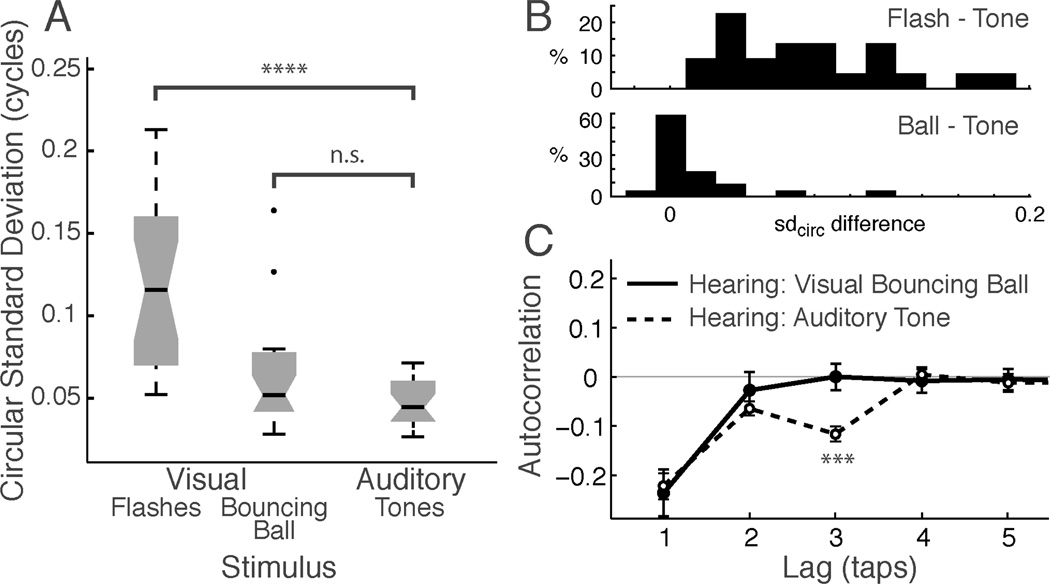
Fig. 2.
Silent moving visual stimuli can drive synchronization nearly as accurately as sound. (A) Synchronization performance (circular standard deviation) for visual flashes, visual bouncing ball and auditory tones for hearing participants. Larger values indicate more variable tapping. Boxes show the median (dark horizontal line), quartiles (box; notch indicates the 95% confidence interval around the median), central 99% of data (whiskers), and outliers (dots). (B) Histograms of the per-subject difference in circular standard deviation (sdcirc) between Flash and Tone (top) and Bouncing Ball and Tone (bottom). (C) Autocorrelation of ITI time series for bouncing ball (solid line, filled circles) and auditory tone (dashed line, open circles). Both conditions show marked negative Lag-1 autocorrelation, but differ in that Lag-3 autocorrelation, which was significantly negative only for tones.

