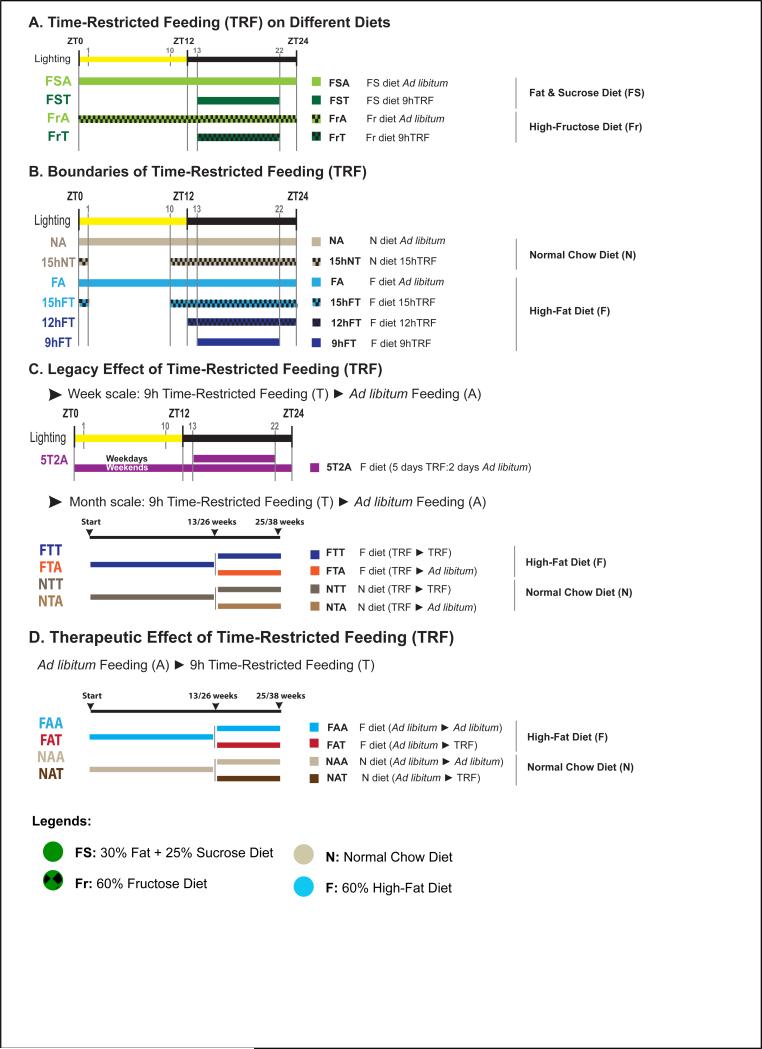
Figure 1. Experimental design.
A-D. Schematic representation of the feeding groups used in this study. The diet, the food access interval, and the lighting schedule are shown. The color code and abbreviations are indicated. Legends show the four diets used in this study. See also supplemental methods for details

