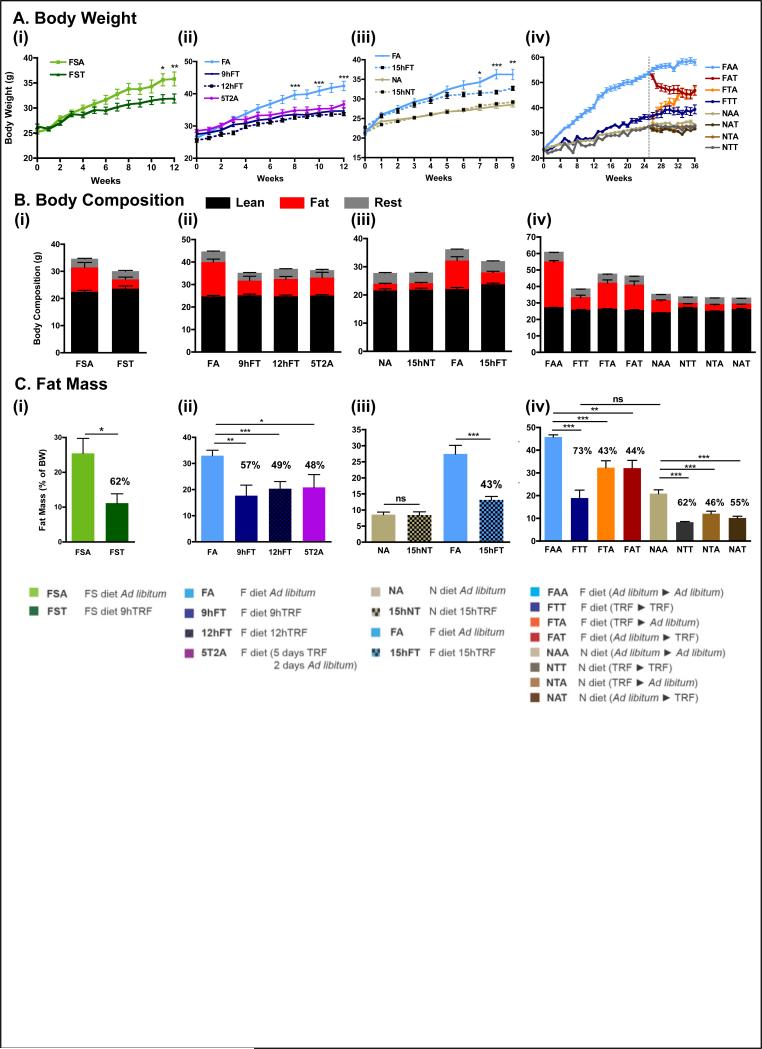
Figure 2. Time-restricted feeding prevents and reverses body weight gain upon different nutritional challenges.
A. Body weight curve for each experimental cohort (see Fig 1, Fig S1 and experimental procedures for cohort description). The number of mice (n) analyzed per group was (i-ii) n=16, (iii) n=12, and (iv) n=32 then 16.
B. Body composition of mice in each feeding group at the end of the study, and corresponding
C. total fat mass as a percent of total body weight. The percentage reduction of fat mass compared to ad libitum fed controls is indicated. (i-ii) n=4 and (iii-iv) n=8.
Data are presented as mean ± SEM. *p < 0.05, **p < 0.01, ***p < 0.001 versus all other groups or versus the ad libitum fed control group as indicated.

