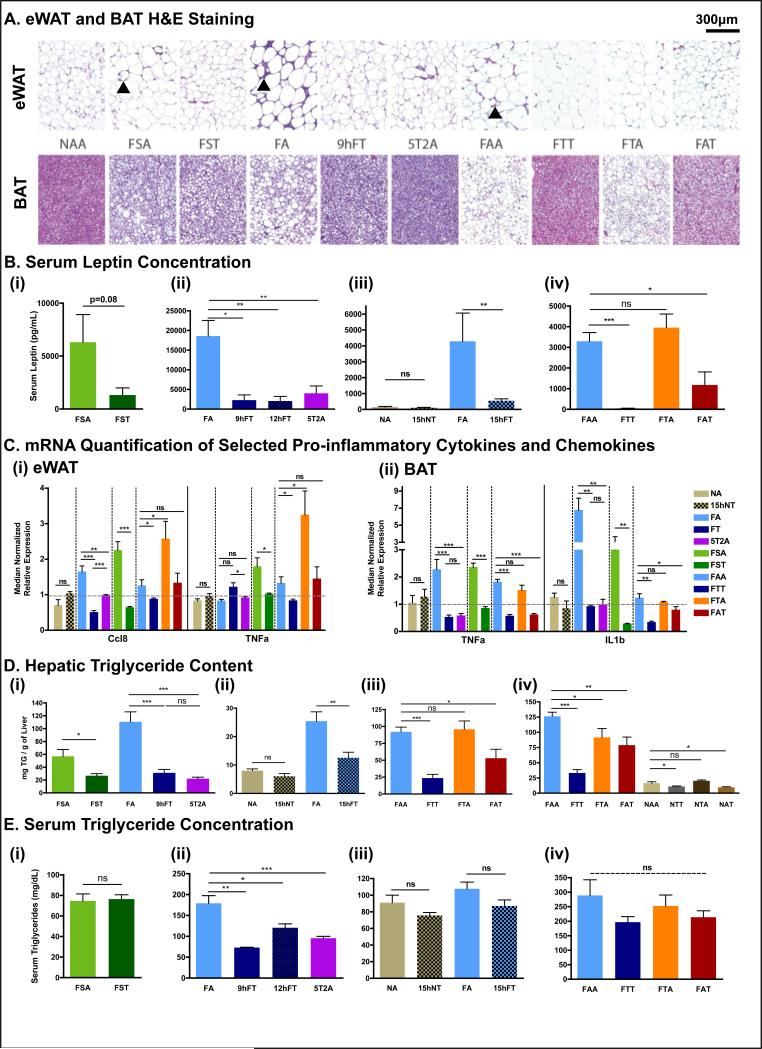
Figure 3. Time-restricted feeding reduces whole body fat accumulation and associated inflammation.
A. Representative H&E stained histological sections of epididymal white adipose tissue (eWAT; upper panels) and brown adipose tissue (BAT; lower panels) in the different feeding conditions, as indicated. Arrowheads point to crown structures.
B. Serum leptin concentration. The number of mice (n) analyzed per group was (i) n=10, (ii) n=8, (iii) n=6, and (iv) n=7.
C. Quantitative polymerase chain reaction (qPCR) analysis of selected pro-inflammatory cytokines (TNFa, IL10, IL1) and chemokine (Ccl8) mRNA expression in (i) eWAT and (ii) BAT. N= pool of 6-8 samples per feeding group. See methods for details.
D. Hepatic triglyceride content. (i) n=6, (ii-iv) n=12.
E. Serum triglyceride concentration. (i) n=10, (ii-iv) n=6.
Data are presented as mean ± SEM. t-test, *p < 0.05, **p < 0.01, ***p < 0.001.

