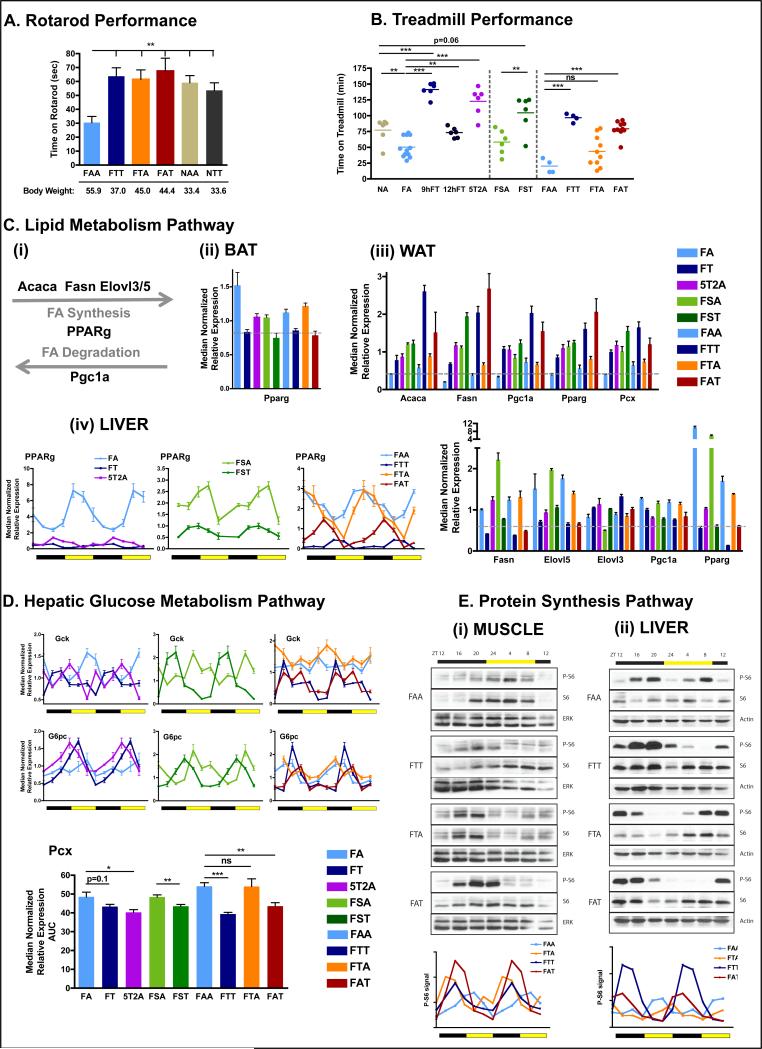
Figure 5. Time-restricted feeding improves nutrient homeostasis.
A. Time on an accelerated rotarod (n=6 mice per group).
B. Time on a treadmill during a run-to-exhaustion assay. Each dot represents one mouse.
C. Schematic (i) and qPCR analysis of lipid metabolism genes Acaca, Fasn,Ppgc1a, Pparg, Pcx, Elovl3, Elovl5 mRNA expression in BAT (ii), eWAT (iii), and liver (iv). N= pool of 6-8 samples per group.
D. qPCR analysis of hepatic mRNA expression of the glucose metabolism pathway genes gck, g6pase, pcx. Results are shown as pooled throughout a circadian time-course or as a double-plotted temporal profile. N= pool of 12 samples per group for pooled data or two mice per time point for temporal profile.
E. Representative scans (top) of western blots showing the temporal expression (total S6) and activation (phospho-Serine 235/236) profiles of the ribosomal protein S6 in muscle (i) and liver (ii). Level of phospho-S6 were quantified using ImageJ from two independent mice per time-point and double plotted (bottom panels).
Data are presented as mean ± SEM. t-tests, *p < 0.05, **p < 0.01, ***p < 0.001 as indicated.

