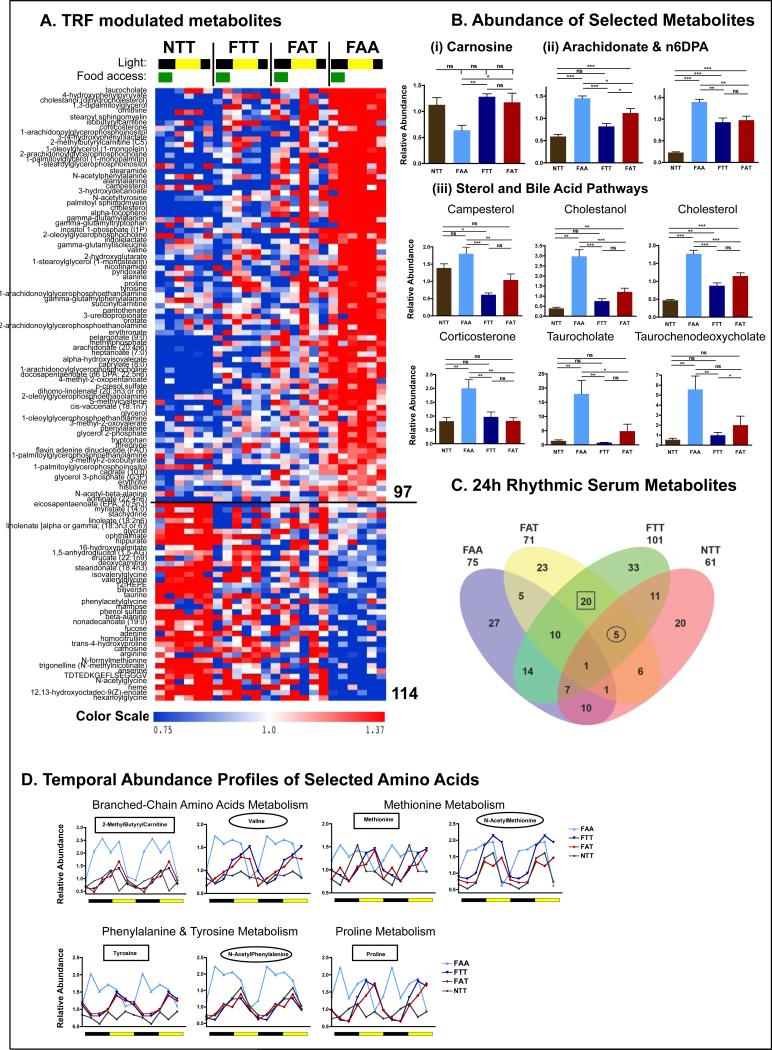
Figure 6. Quantitative and temporal changes in the serum metabolome reflect the whole-body beneficial effect of time-restricted feeding.
A. Heatmap representation of 114 metabolites that exhibit a statistically significantly change (p<0.05) between the super group “TRF fed mice” (NTT, FTT, FAT) and the group “ALF fed mice” (FAA). Lighting regimen is depicted in black and yellow and food access in green.
B. Serum abundance (median normalized) of (i) carnosine, (ii) pro-inflammatory lipids arachidonate (AA) and docosapentaenoic acid (22:5 n6) (n6DPA), and (iii) sterol pathway and bile acid pathway components campesterol, cholestanol, cholesterol, corticosterone, taurocholate, and taurochenodeoxycholate. Data are presented as mean ± SEM. t-tests, *p < 0.05, **p < 0.01, ***p < 0.001 as indicated.
C. Venn diagram representation of 24-hour rhythmic serum metabolites identified by JTK_CYCLE (t<0.05) (Hughes et al., 2010).
D. Temporal abundance profiles of serum metabolites belonging to the indicated amino acid pathway.

