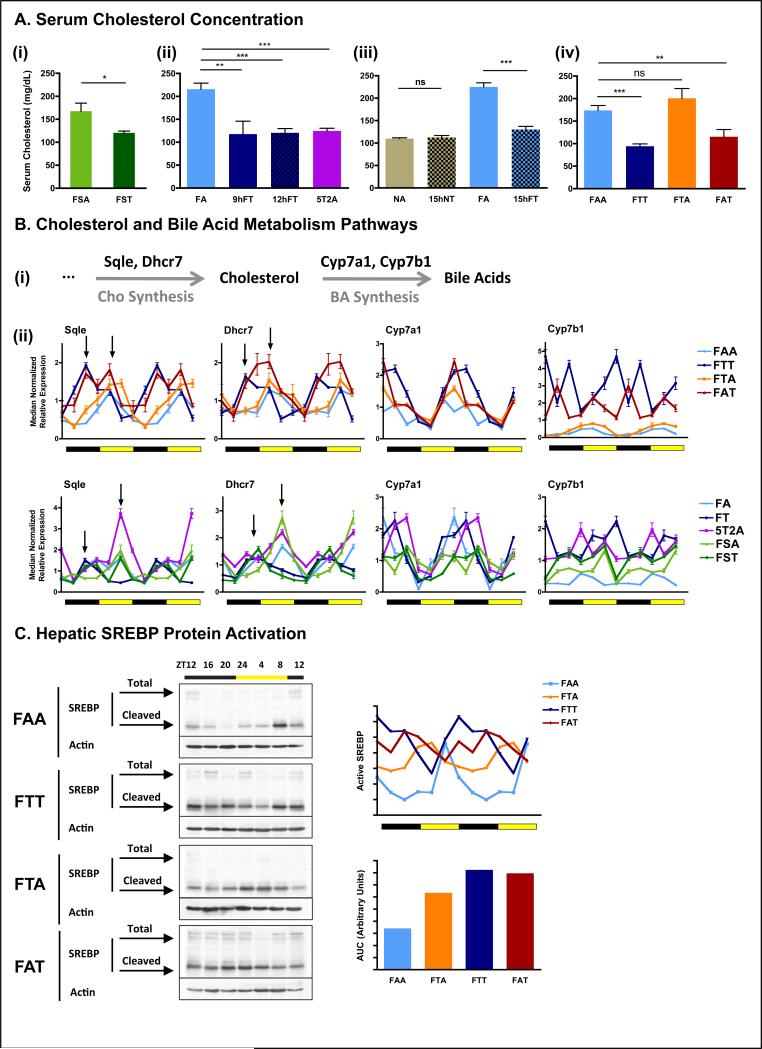
Figure 7. Time-restricted feeding restores cholesterol homeostasis.
A. Serum cholesterol concentration in the different feeding groups. The number of mice (n) analyzed per group was (i) n=10, and (ii-iv) n=6.
B. (i) Schematic and (ii) hepatic qPCR analysis of cholesterol and bile acids metabolism enzymes Sqle, Dhcr7, Cyp7a1 and Cyp7b1. Data are shown as a double-plot showing the temporal expression profile at different times of the day (n=2 mice per time point per group).
C. Representative western blots depicting the protein temporal expression profile (upper band) and activation profile (shorter cleaved form) of the sterol regulatory element binding protein (SREBP) in the liver. Level of active SREBP (cleaved short form) was quantified using ImageJ from two independent mice per time-point and double plotted (right panel).
Data are presented as mean ± SEM. *p < 0.05, **p < 0.01, ***p < 0.001 versus the ad libitum fed control group as indicated.

