
Figure 1.
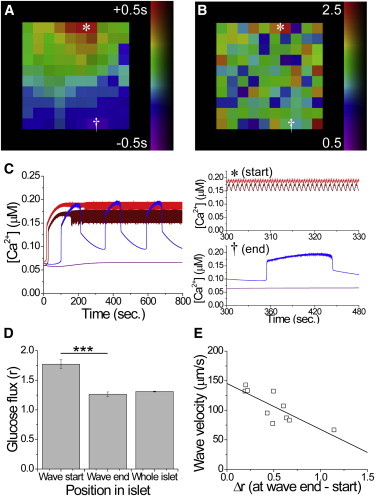
The computational islet model predicts that heterogeneity correlates with calcium wave propagation. (A) Representative phase map of the surface of a modeled islet, showing the temporal progression of wave propagation. (B) Map of the metabolic flux (r) at the surface in panel A. ∗ and † indicate the start and end of a wave, respectively. (C) Representative time courses of [Ca2+]i in cells corresponding to the start (∗red) and end († blue) of the wave, indicated in A and B, when electrically isolated from the modeled islet. (D) Mean (± SEM) metabolic flux (r) in cells averaged over the start and end of the wave (n = 3–8 cells per region) and over the whole islet. (E) Correlation between the calcium wave velocity and the difference in glucose metabolic flux (Δr) between the start and end of the wave. The solid line indicates a linear fit. Equation 2 describes gap junction coupling. Data in D and E were averaged over 10 modeled islets. ∗∗∗ indicates significant difference comparing each group indicated (p < 0.001, Student’s t-test). To see this figure in color, go online.