
Figure 2.
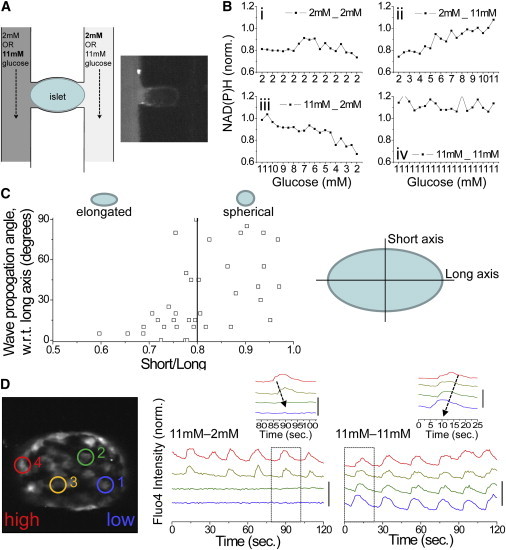
Testing the dependence of calcium wave propagation on islet heterogeneity via a glucose gradient. (A) Schematic of the islet and microfluidic device used. Inset shows Rhodamine B applied to a single channel, indicating no cross-talk. (B) Normalized (norm.) NAD(P)H response, indicating glucose metabolic flux across the islet under each glucose stimulation pattern used. The x axis indicates the estimated glucose. (C) Calcium wave direction with respect to the long axis of the islet, plotted as a function of islet elongation (short axis length/long axis length, where short/long = 1 represents a spherical islet). The solid line delineates islets with a long axis 25% greater than the short axis. (D) Representative time courses of [Ca2+]i at positions indicated in the islet under a glucose gradient (11mM-2mM) and uniform elevated glucose (11mM-11mM). Inset: close-up of a single pulse, indicating the propagation of a calcium wave under each condition. Time courses are offset for clarity; vertical bar indicates a 50% increase in fluorescence. To see this figure in color, go online.