
Figure 4.
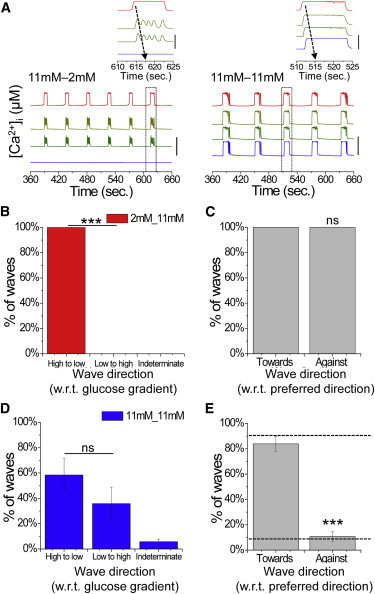
Computational model dependence of calcium wave propagation direction on islet heterogeneity. (A) Representative time courses of [Ca2+]i at positions across the modeled islet under a gradient of glucose metabolism (11mM-2mM) and uniform elevated glucose metabolism (11mM-11mM). Inset: close-up of a single pulse, indicating the propagation of a calcium wave under each condition. Time courses are offset for clarity; vertical bar indicates a change of 0.1 μM. (B) Proportion of calcium waves that propagate with respect to an applied glucose metabolism gradient originating from the side at elevated glucose metabolism (high to low) or the side at low glucose metabolism (low to high), or in an unrelated direction (indeterminate). (C) Proportion of calcium waves under a gradient that propagate with respect to the preferred wave direction at uniform glucose metabolism, where the gradient is applied toward or against the preferred direction. (D) Proportion of calcium waves under uniform glucose metabolism that propagate in directions with respect to a previous gradient, as in B. (E) Proportion of calcium waves under uniform glucose metabolism that propagate with respect to the preferred wave direction, where a gradient is previously applied toward or against the preferred direction. The dashed line indicates that the direction is solely determined by intrinsic cellular heterogeneity. Equation 2 describes gap junction coupling. Data in B–E were averaged over 10 modeled islets. ∗∗∗ indicates significant difference comparing the indicated experimental groups (p < 0.001, Student’s t-test). ns, no significant difference (p > 0.05). To see this figure in color, go online.