
Figure 6.
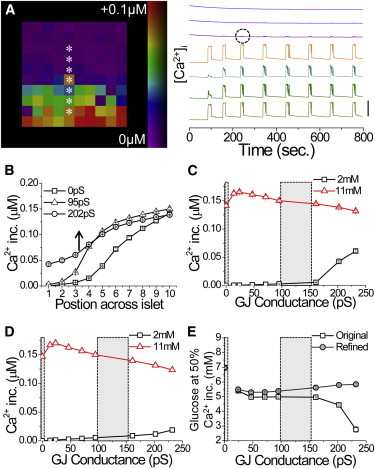
Modeling the dependence of the [Ca2+]i response on gap junction coupling under a glucose gradient. (A) Map of [Ca2+]i elevation upon a gradient of glucose metabolism, with [Ca2+]i time courses from cells indicated by ∗. Time courses are offset for clarity; vertical bar indicates a change of 0.1 μM. Excitation bleed-through is circled. (B) Mean [Ca2+]i response across the islet for different levels of gap junction conductance (mean values indicated). (C) Mean [Ca2+]i response as a function of gap junction conductance, at positions across the islet equivalent to the glucose concentrations indicated. (D) Mean [Ca2+]i response as a function of gap junction conductance as in D, for the model accounting for the gap junction electrochemical gradient. (E) Equivalent glucose concentration at which the [Ca2+]i response is 50% of the maximum, as a function of gap junction conductance for the original model (original) and improved model (refined). In C–E, areas in gray correspond to Cx36−/− and WT gap junction conductance values. A–C and E utilize Eq. 2, and D and E utilize Eq. 5 to describe gap junction coupling. To see this figure in color, go online.