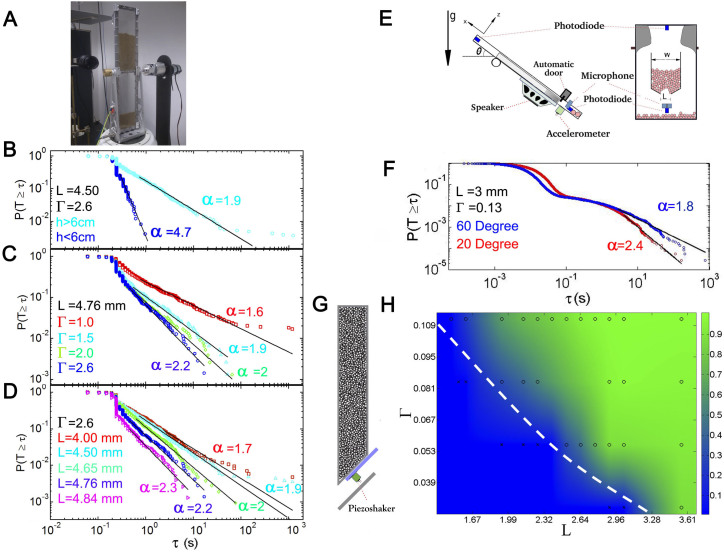
Figure 3. Time lapse distributions in three different silos.
(A) Photograph of the two-dimensional silo filled with 1 mm particles. (B) Time lapse complementary CDFs obtained using L = 4.50 and Γ = 0.26 for two different heights of the layer of grains (h > 6 cm and h < 6 cm). (C) Time lapse complementary CDFs obtained for h > 6 cm, L = 4.76 and several Γ as indicated in the legend. (D) Time lapse complementary CDFs obtained for h > 6 cm, Γ = 0.26, and several outlet sizes as indicated in the legend. (E) Sketch of the inclined hopper. (F) Time lapse complementary CDFs obtained using two different inclination angles. (G) Sketch of the 3-D hopper vibrated at the orifice7. (H) Phase diagram for the plane Γ–L obtained for the 3-D hopper. The values measured experimentally are marked by crosses (Φ = 0) or circles (Φ > 0). The colour scale from blue to green (as indicated by the colour bar) is a linear interpolation for the values of Φ. The dashed white line is a guide to the eye for the transition from Φ = 0 to Φ > 0.

