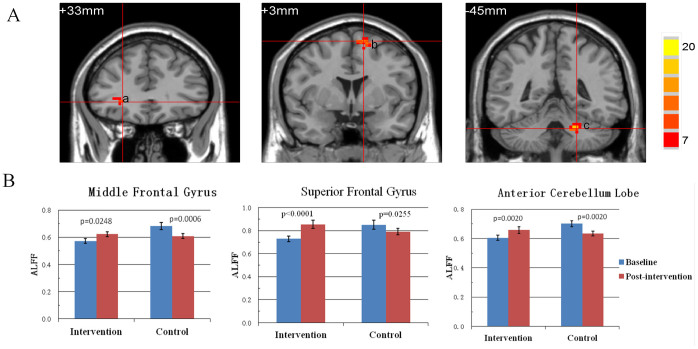
Figure 2. Impact of multimodal intervention on MFG, SFG and ACL.
(A) Coronal view of brain regions showing significant Group × Intervention interactions (AlphaSim correction, p < 0.01). (a) right MFG; (b), left SFG; (c), left ACL. The numbers above each image refer to the plane coordinates of MNI. Left in picture is right in the brain. (B) Bar plots show the mean ALFF prior to and after intervention for the intervention and control group.

