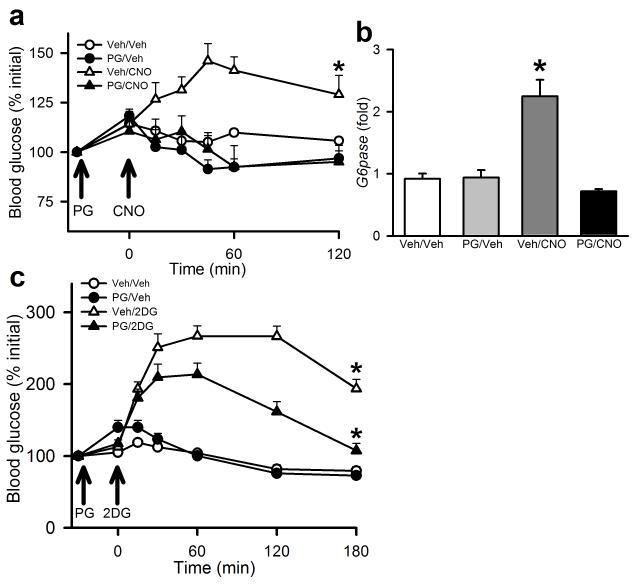
Figure 6. CCK-dependence of the hyperglycemic responses to activation of PBN LepRb neurons and glucoprivation.
(a, b) Male Leprcre mice were injected bilaterally with the activating DREADD hM3Dq and allowed to recover for at least two weeks. Animals were injected with Proglumide (PG; 20 mg/kg, IP) or Vehicle (Veh) and 30 minutes later were injected with vehicle or CNO (0.3 mg/kg, IP) and (a) blood glucose was monitored at the indicated times; {F(3,16)=6.19}, N=3(v/v), 3 (pg/v), 7(v/c), and 7 (pg/c) animals. (b) Hepatic G6Pase mRNA expression (fold over control) was measured at the end of the experiment; p<0.001 from all groups {F(3,13)=21.839}, N=5 (v/v), 4 (pg/v), 4 (v/c), and 4 (pg/c) animals. Aall data are plotted as mean +/− SEM (c) C57Bl/6 mice were injected with Proglumide (PG; 100 mg/kg, IP) or Vehicle and 30 minutes later were injected with vehicle or 2DG (500 mg/kg, IP) and blood glucose was monitored at the indicated times; {F(3,25)=43.47}, N=6 (v/v), 7 (pg/v), 8 (v/2dg), and 8 (pg/2dg) animals. All data are plotted as mean +/− SEM. The data included in panels a and c were analyzed by two way repeated measures ANOVA with Fisher LSD post hoc test; the data in panel b was analyzed by one way ANOVA with Fisher LSD post hoc test. A:*p=0.006 vs(PG/Veh), 0.001 vs (PG/CNO), and 0.031 vs (Veh/Veh). C:*p<0.001 vs all groups.

