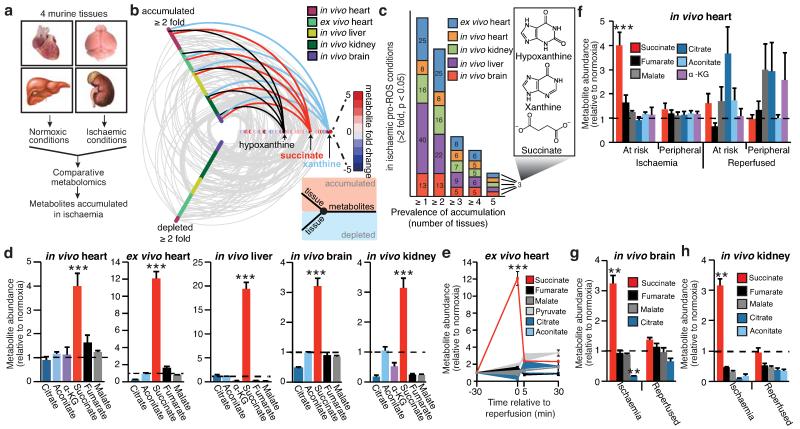
Figure 1.
Comparative metabolomics identifies succinate as a potential mitochondrial metabolite that drives reperfusion ROS production. a, Comparative metabolomics strategy. b, HIVE plot comparative analysis. All identified metabolites are identified on the horizontal axis, while those accumulated (top axis) or depleted (bottom axis) in a particular ischaemic tissue are indicated by a connecting arc. Metabolites accumulated commonly across all tissues are highlighted. c, Prevalence of accumulation of metabolites in murine tissues during ischaemia. d, Profile of mitochondrial CAC metabolite levels following ischaemia across five ischaemic tissue conditions. (in vivo heart n = 5; succinate and fumarate n = 9), (ex vivo heart n = 4), (liver n = 4), (brain n = 3), (kidney n = 4). e, Time course of CAC metabolite levels during myocardial ischaemia and reperfusion for 5 min in the ex vivo heart (n = 4). f, CAC metabolite levels during in vivo myocardial IR in at risk and peripheral heart tissue following ischaemia and after 5 min reperfusion. (n = 5; succinate and fumarate n = 9). g, CAC metabolite levels during in vivo brain IR following ischaemia and following 5 min reperfusion (n = 3). h, CAC metabolite levels during in vivo kidney IR following ischaemia and after 5 min reperfusion (n = 4; aconitate n = 3). ** p < 0.01, *** p < 0.001. Data are shown as the mean ± s.e.m of at least three biological replicates.

