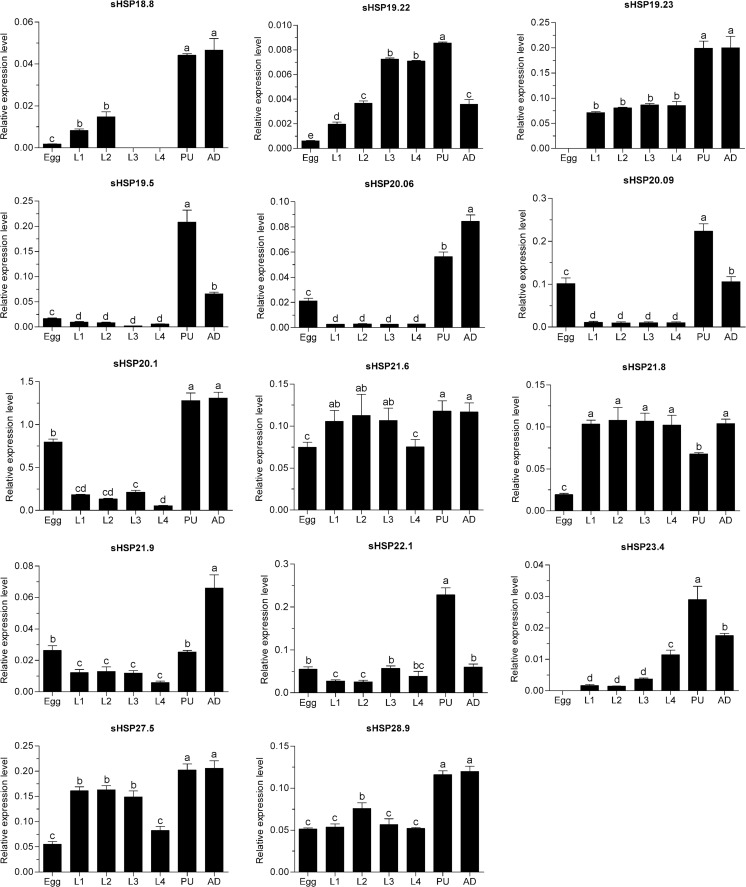
Fig. 3.
Relative mRNA expression levels of the DBM sHSPs in different developmental stages. Expression levels were assessed using actin gene for normalization. Different letters on the tops of the column indicate significance in the different expression levels by ANOVA. L1 the first instar larvae, L2 the second instar larvae, L3 the third instar larvae, L4 the fourth instar larvae, PU pupae, AD adult

