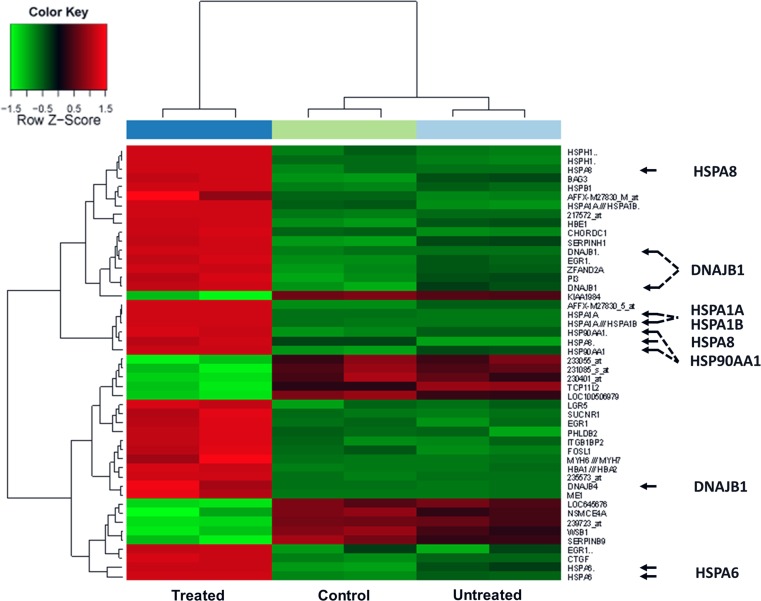
Fig. 1.
Heat map on gene expression summarizing transcripts showing significantly differential expression 4 h after mEHT treatment of HT29 colon cancer xenografts. Arrows highlight the elevated expression (red boxes) of heat shock protein genes from the Hsp70, Hsp40, Hsp90, and Hsp60 families in the treated samples (left column) compared either to sham treated (middle) and untreated samples (right)

