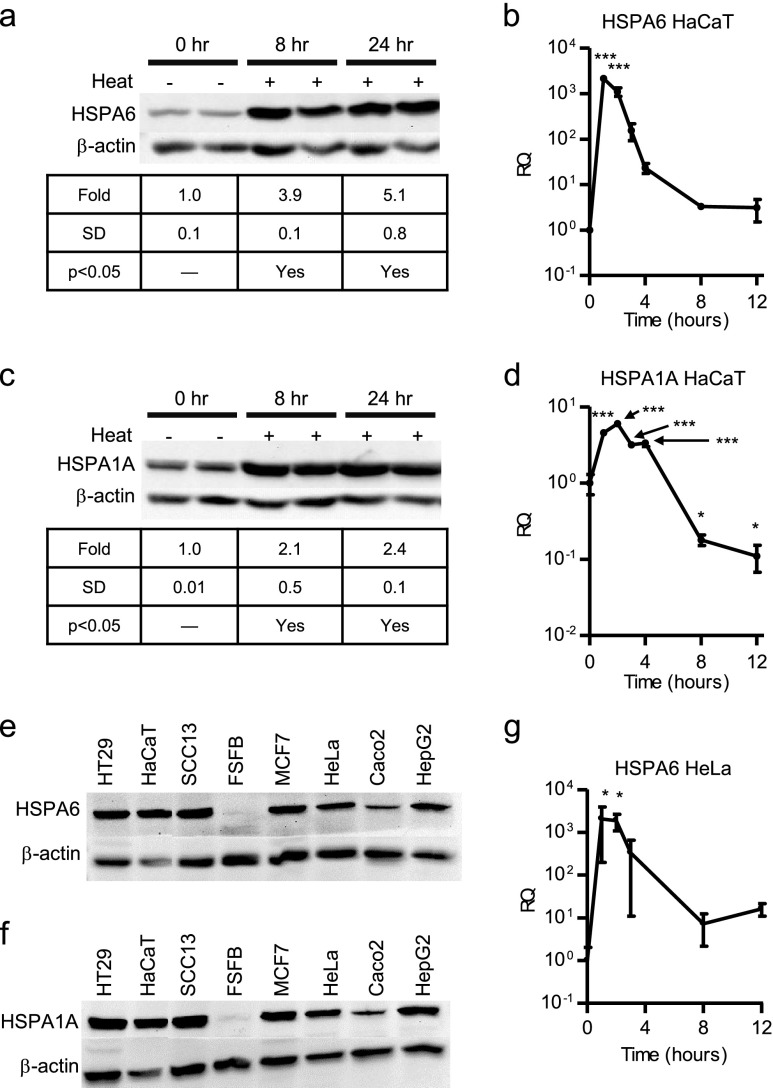
Fig. 1.
Basal and heat-inducible expression of HSPs. Protein expression of HSPA6 (a) and HSPA1A (c) before (0 h) and post-heat shock (8 and 24 h). Samples shown from duplicate cultures. Quantitation of band intensity shown as average of duplicate cultures. mRNA expression of HSPA6 (b) and HSPA1A (d) in HaCaT cells and HSPA6 in HeLa cells (g) before (0 h) and post-heat shock (1, 2, 3, 4, 8, and 12 h). Protein expression of HSPA6 (e) and HSPA1A (f) in various unstressed cells. β-Actin used as a loading control for all Western blots. Statistically significant values are indicated using a p value <0.05 as determined using ANOVA with Dunnett’s post hoc. Points are mean + SD from one experiment, each point from replicate cultures

