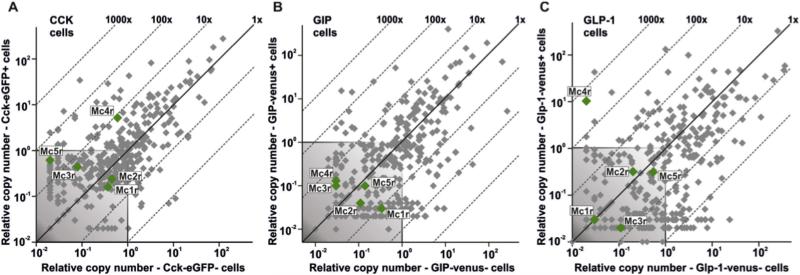
Figure 1. Expression of Melanocortin Receptors in Enteroendocrine Cells.
Scattergrams exhibiting qPCR expression of the five melanocortin receptors (annotated green dots) among 379 7TM receptors (grey plus green dots) examined in FACS-purified cells from the proximal small intestine from transgenic (A) CCK-eGFP, (B) GIP-Venus, and (C) GLP-1-Venus reporter mice (X-axis) versus expression in non-fluorescent mucosal cells (Y-axis). The 45°-angled lines indicate the enrichment of expression in the fluorescent FACS-purified enteroendocrine cells versus the neighboring enterocytes. The grey shaded area in each of the scattergrams is considered as noise level.

