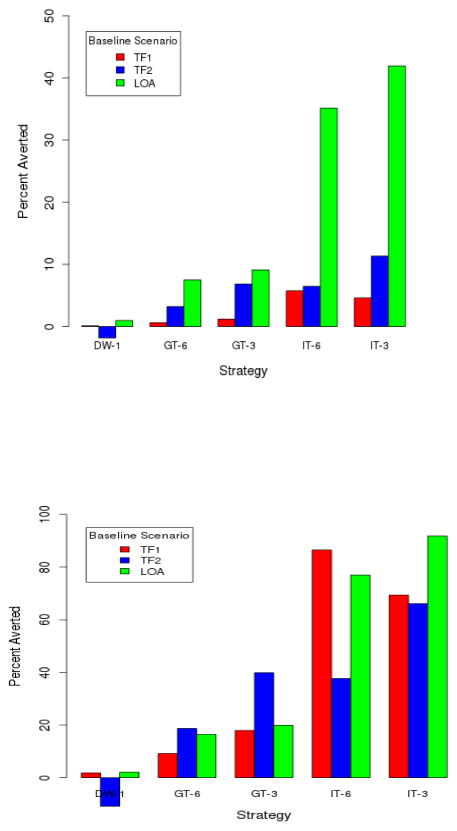
Figure 1.
(Top) Number of infections prevented by each intervention relative to baseline. (Bottom) Number of infections prevented by each intervention relative to maximum possible, defined as the difference between the mean number of infections in the baseline and best case interventions. In each case, results are averaged across 10 stochastic model runs.

