
Fig. 2.
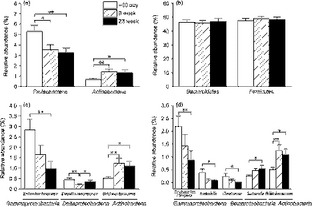
Dietary intervention changed intestinal microbiota. Groups of bacteria changed at the (a), (b) phylum, (c) family, and (d) genus levels. Bacteria numbers are expressed as the proportion of total intestinal microbiota, and data are mean ± SEM. *P < 0.05; **P < 0.01.