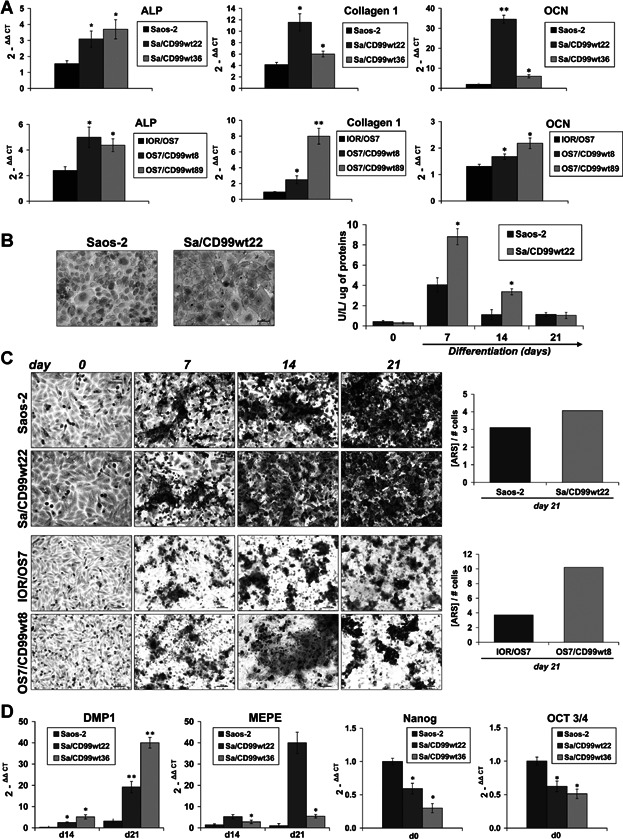
Fig. 2.

CD99 drives OS cells toward a terminally osteoblast differentiated phenotype. (A) qRT-PCR expression of representative osteoblast differentiation markers in CD99-overexpressing clones and parental cell lines: collagen 1, ALP, and OCN are displayed to sign early and late stages of the differentiation process. The relative expression of target mRNA was calibrated on undifferentiated cells at day 0 (2-ΔΔCT = 1). Data are presented as mean ± SEM of experiments performed in triplicate. Student's t test was used (*p < 0.05; **p < 0.01). (B) Evaluation of ALP expression by histochemical analysis (left panel) and activity in supernatants (right panel) data are presented as mean ± SEM of two separate experiments. Student's t test was used (*p < 0.05). (C) ARS staining of mineralized cultures over 0 to 21 days in differentiation medium. On the right of the panel, production of bone matrix corrected by cell number is shown. (D) qRT-PCR expression of the osteocyte markers DMP1 and MEPE during differentiation (days 14 and 21) and of Nanog and OCT3/4 in basal conditions (day 0). The relative expression of target mRNA was calibrated on the parental cell line (2-ΔΔCT = 1). Data are presented as mean ± SEM of experiments performed in triplicate. Student's t test was used (*p < 0.05; **p < 0.01).
