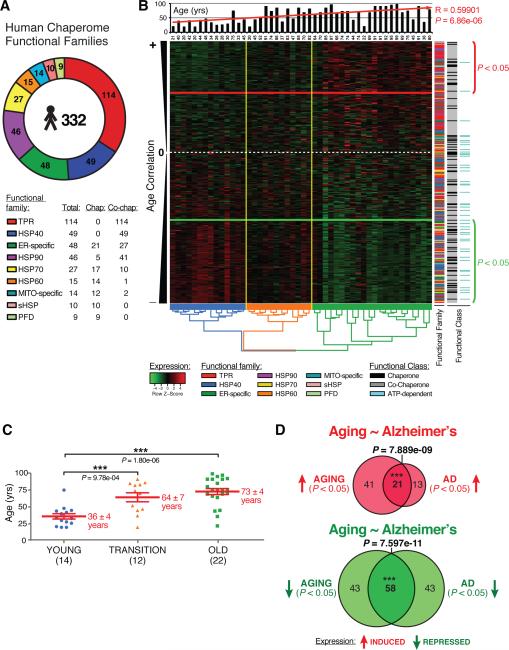
Figure 1. Differential Chaperome Responses in Human Brain Aging and Neurodegenerative Disease.
A The Human chaperome. Functional families and number of members are indicated. B. Heat map showing 318 chaperones expressed in human brain (Super Frontal Gyrus) ordered by decreasing age-correlation. The white dashed-line indicates age-expression correlation coefficient closest to zero. Genes above the red line are induced (P < 0.05), genes below the green line are repressed (P < 0.05). The histogram visualizes specimen age upon hierarchical clustering. The dendrogram visualizes hierarchical clustering of brain specimens. The y-axis color code highlights from left to right the nine chaperome families, chaperones (black), co-chaperone (grey) and ATP-dependent chaperones (turquoise). C. Three major age groups (“young” - blue, “transition” - orange, “old” - green) are visualized by dendrogram coloring in B. Values are mean age +/− SEM. *** P < 0.001, Student's t-test. D. Overlaps of chaperones induced (red) or repressed (green) in aging vs. AD. (See Figure S1, S2, S3).

