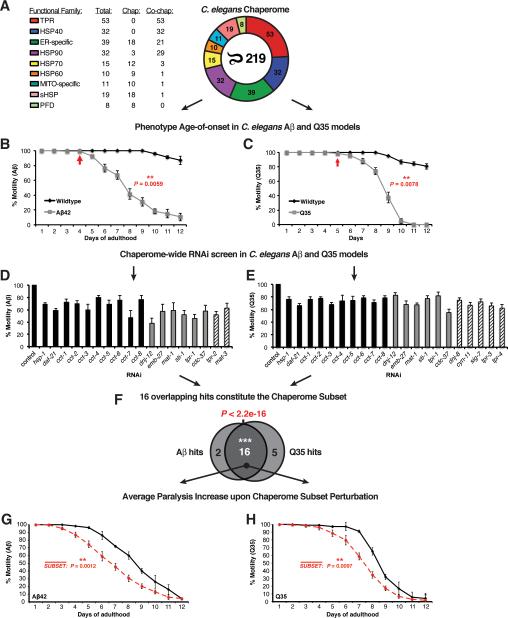
Figure 3. Functional Chaperome Perturbation Analyses in C.elegans Models of Protein Misfolding.
A. The C. elegans Chaperome with its functional families and numbers of members per family are shown. B. Paralysis (% motility) for wild type and Aβ42 expressing C. elegans from day 1 to day 12 of adulthood. Arrow indicates paralysis age-of-onset. C. Motility defects for wild type and Q35-expressing C. elegans from day 1 to day 12. Arrow indicates age-of-onset. D. RNAi paralysis phenotypes on day 4 of adulthood (% motility) for C. elegans expressing Aβ42 (Mean ± SEM, n=3 and n ≥ 25 animals/trial). E. RNAi motility defects on day 2 of adulthood (% motility) for C. elegans expressing Q35 (Mean ± SEM, n=3 and n ≥ 25 animals/trial). F. Venn diagram indicating significant overlap of 16 hits from both screens (P < 2.2e-16, Fisher's exact test). G. Average paralysis (% motility) for RNAi of all 16 chaperome subset genes in Aβ42 expressing C. elegans throughout adulthood (days 1 to 12). Data points are means of corresponding data points in each RNAi experiment, each based on n ≥ 3 independent experiments and n ≥ 25 animals/trial. ** P < 0.01, Student's t-test. H. Average paralysis (% motility) for chaperome subset RNAi in Q35 expressing C. elegans throughout adulthood (days 1 to 12). Data points as in G. (See Figure S4).

