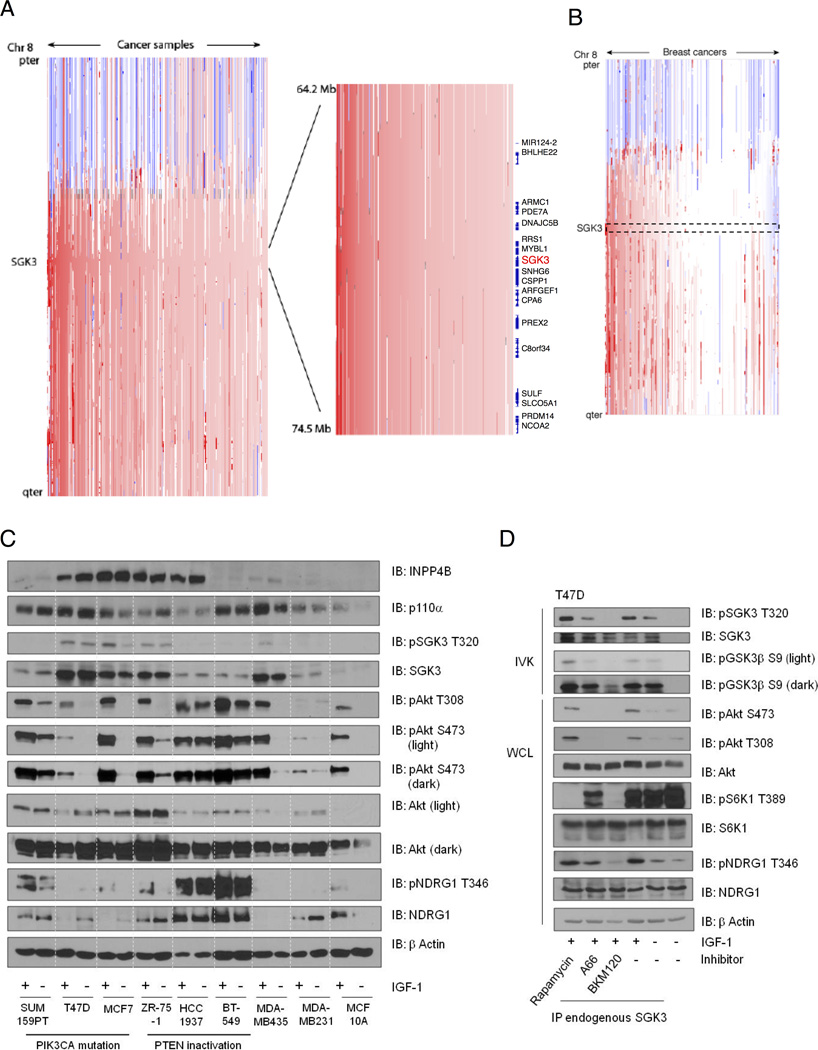
Figure 1. SGK3 is amplified in breast cancer.
(A) Copy-number profiles across chromosome 8 (y-axis) for 3,131 cancer samples (x-axis). A magnified view of the region including the SGK3 gene locus is shown in the inset. Analysis was performed from a data set obtained from a study of 3,131 cancers of over 25 subtypes. Samples are sorted by frequency of amplification at the SGK3 locus.
(B) Copy-number profiles from 243 breast cancers selected from the data set described in (A).
(C) Cell lysates derived from the indicated breast epithelial and cancer cell lines, serum-starved (−) or stimulated with IGF-1 for 20 min (+) were immunoblotted (IB) with the indicated antibodies.
(D) T47D cells were serum-starved for 24 hr, then pretreated with the invocated inhibitors, rapamycin (100nM), A66 (1µM) or BKM120 (1µM) for 20 min, then stimulated with IGF-1 for a further 20 min. SGK3 was immunoprecipitated with anti-SGK3 and subjected to an in vitro kinase assay (IVK) using GSK-3β peptide substrate. Peptide substrate phosphorylation was detected using anti- GSK-3β pS9-antibody. SGK3 phosphorylation was detected using anti-SGK3 pT320. Total SGK3 was evaluated as control. Whole cell lysates were immunoblotted with the indicated antibodies. All results are representative of at least 3 independent experiments. See also Figures S1 and S5.

