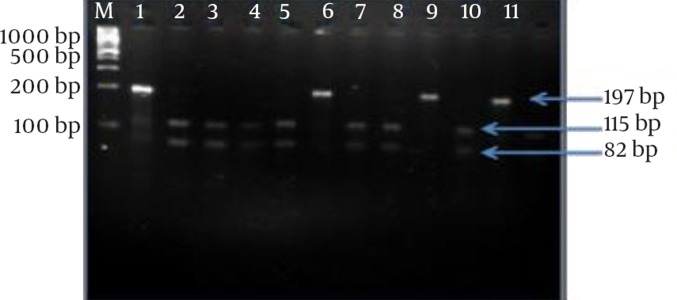
Figure 2. Electrophoretic Analysis of the fliC Gene After Enzymatic Treatment With Hinp1I Restriction Enzyme.

M: 100 bp marker plus DNA ladder (Fermentas Inc.); lane 1: S. pullorum positive control; lane 2: S. gallinarum positive control; lanes 3, 4, 5, 7,8,10 and 12: S. gallinarum isolates; lanes 6, 9, and 11: S. pullorum isolates.
