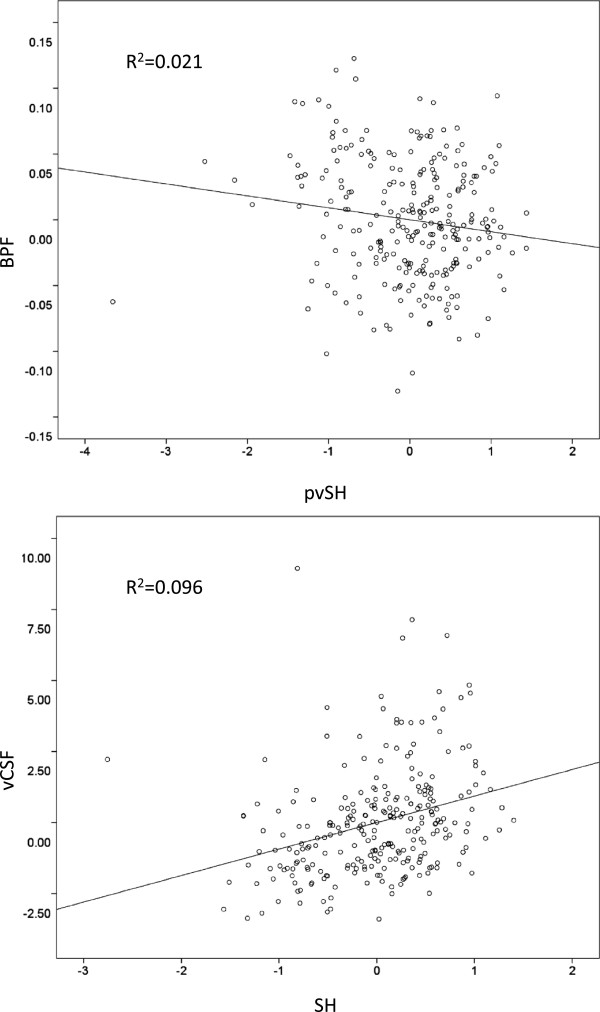
Figure 1.

Partial regression plots illustrating the relationships in Alzheimer’s disease patients between atrophy measured by brain parenchymal fraction (BPF) and periventricular subcortical hyperintensity (pvSH) volume (top), and between atrophy measured by ventricular cerebrospinal fluid (vCSF) volume and subcortical hyperintensity (SH) volume (bottom).
