
Figure 1.
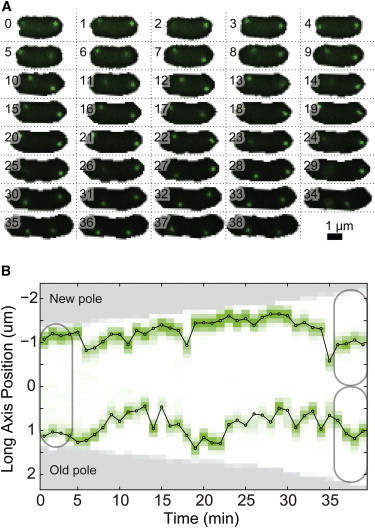
(A) Wide-field fluorescence images showing the dynamics of MS2-mRNA complexes in a typical cell throughout the entire cell cycle. Frame numbers are measured in minutes. (B) Kymograph of MS2-mRNA cell-cycle trajectory plotted along the long axis of the cell shows dynamic localization of protein complexes throughout the cell cycle. To see this figure in color, go online.