
Figure 3.
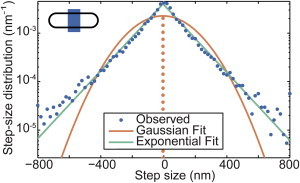
Step-size distribution. The step-size distribution is shown for MS2-mRNA complexes for a 1 min lag time for complexes with an initial position in the middle fifth of the cell, as illustrated in the inset. The data (blue circles) are compared with two models for the step-size distribution: exponential (green line) and Gaussian (orange line). Both models have the same mean and variance as the experimental data. The observed step-size distribution is in excellent agreement with the exponential model (N = 8053 trajectories). To see this figure in color, go online.