
Figure 4.
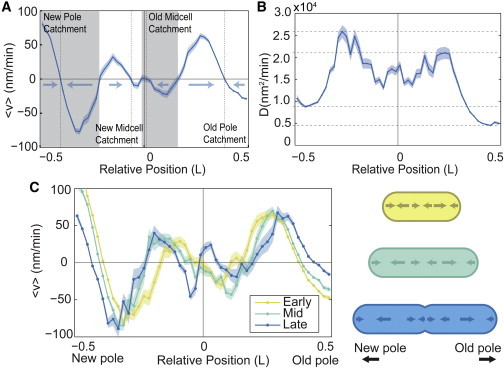
(A) Annotated map of drift velocity averaged over the cell cycle, with stable points (dashed lines) and catchment regions (gray and white regions) annotated. (B) Map of diffusion coefficient along the long axis of the cell averaged over the cell cycle. The highest mobility occurs over regions occupied by the nucleoid (± 0.25 cell lengths). The lowest mobility is observed at the old pole. (C) The drift velocity map shown for three relative cell-cycle times (early, mid, late) displays weak cell-cycle dependence. During the last third of the cell cycle, the velocity map is qualitatively changed at midcell, where the centrally located stable point divides into two stable point before division. (For all, N = 8053 trajectories.) To see this figure in color, go online.