
Figure 5.
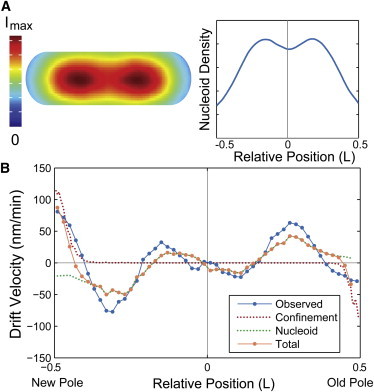
(A) At the left, nucleoid density in the cell. Cell-cycle and cell-to-cell mean interpolated fluorescent image of DAPI stained nucleoids (N = 369). At the right, nucleoid density as the sum of intensity of DAPI-stained nucleoids over the minor axis of the cell for relative positions along the major axis of the cell. (B) Comparison between predicted and measured velocity profiles. Measured velocity profile (blue) and predicted velocity profiles because of confinement at the poles from the inner membrane (red dotted) and nucleoid exclusion (green dotted) versus relative cell position. The combination of the two predicted velocity profiles (orange) is in excellent agreement with the measured profile. To see this figure in color, go online.