
Figure 1.
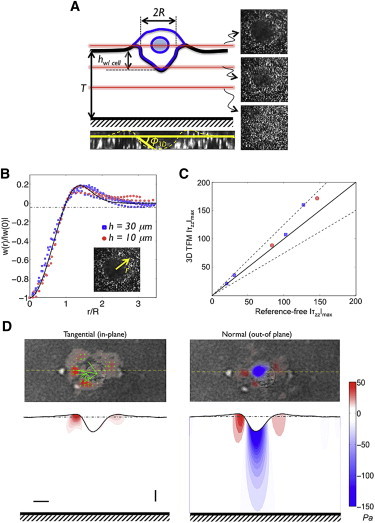
Quantitative single-cell invasion assay. (A) Schematic representation of a cancer cell (MDA-MB-231) invading a Matrigel network embedded with 200 nm fluorescent beads and tethered onto glass. Experimentally obtained confocal z-stack images are shown. The red lines illustrate the confocal sectioning along the vertical axis of the invading cells. hw/cell and R denote the depth and radius, respectively, of matrix indentation during cell invasion. T is the thickness of the Matrigel. ϕ3D is the indentation angle, defined as ϕ3D = tan−1(hw/cell/R). (B) Indentation profiles generated by invading cells along the radial direction (inset) are shown in blue squares and red circles for cells in 30-μm- (n = 4) and 10-μm-thick (n = 2) Matrigels, respectively. The black line is a semiempirical fit, which shows an agreement between the experimental data and the model and satisfies mechanical equilibrium. The y axis indicates the normal deformation at various radial locations, w(r), normalized to the deformation at the center of the indentation, w(0). (C) Maximum compressive stresses exerted by the cells depicted in B, obtained using our novel reference-free TFM method (x axis) and the 3DTFM method of del Alamo et al. (26) (y axis). The solid line represents x = y (zero error), and the dashed lines represent y = 0.75× and y = 1.25×. (D) Tangential and normal traction stresses of MDA-MB-231 cells elastically deforming a 30-μm-thick Matrigel obtained using 3DTFM. Upper images display the traction stresses on the free surface of the gel (i.e., the xy plane) superimposed on the differential interference contrast cell image. The lower images display the measured traction stresses and deformation profile on the vertical section of the gel (i.e., the xz plane), corresponding to the yellow dashed lines in the upper images, showing the propagation of normal stresses into the gel. The color bar represents the magnitude of the stresses, and the green arrows indicate the direction and magnitude of the tangential stresses. Horizontal and vertical scale bars are 5 and 1 μm, respectively. To see this figure in color, go online.