Fig. 6.

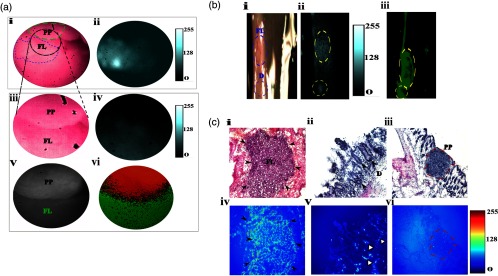
In vivo and ex vivo fluorescence and polarization endoscopy of flat lesion-surrounding uninvolved boundary. (a) In vivo fluorescence and polarization endoscopy. (i) RGB color image of the flat lesion identified in the distal colon of an AOM-DSS treated mouse. Dotted green line outlines the boundary of the Peyer’s patch. Dotted blue line outlines the boundary of the flat lesion biopsied in accordance to corresponding fluorescence image. Dotted black circle identifies the region that was investigated more closely (iii) and serves as the field-of-view (FOV) region for the remaining in vivo images. Grayscale image consisting of DoLP and AOP information in the polarization mode at 30 fps. (v) Corresponding region to (iii) identified by polarization camera in grayscale. (vi) Thresholded DoLP mask image identifies Peyer’s patch (reported as DoLP value above 10%; red color) and flat lesion (reported as DoLP value less than 5%; green color). (b) Ex-vivo RGB (i), NIR fluorescence (ii), and DOLP (iii) images of flat lesion identified in (a). Dotted blue line indicates the boundary of the flat lesion (FL) and dysplastic tissue (d). (ii) Corresponding NIR fluorescence image demonstrates fluorescence signal from flat lesions and dysplastic tissue. (iii) Dotted red lines indicate the corresponding flat lesion and dysplastic tissue. Thresholded DoLP mask image identifies cancerous regions (DoLP value under 10%; green color) (c) Histological validation of flat lesion, dysplastic tissue, and Peyer’s patch identified in (a) and (b) along with corresponding NIR fluorescence intensity, respectively. For the flat lesion, black solid arrows indicate the boundary of tumor in the H&E and NIR fluorescence images. For dysplastic tissue, black solid arrows indicate the aberrant crypts identified by LS301 in the H&E image and white solid arrows in the NIR fluorescence image. A dotted red line indicates the boundary of the Peyer’s patch in the H&E and NIR fluorescence images. PP: Peyer’s patch, FL: flat lesion.
