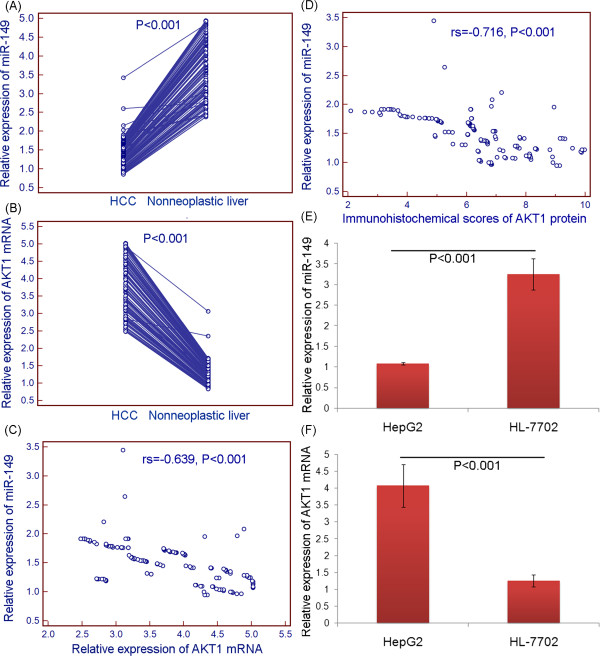
Figure 4.

Reverse correlation between miR-149 and AKT1 mRNA expression in human HCC tissues and cells. (A and B) Relative expression of miR-149 and AKT1 mRNA in 130 self-pairs of HCC and adjacent nonneoplastic liver tissues; (C) Spearman Correlation analysis clearly showed a negative correlation between miR-149 and AKT1 mRNA expression in HCC tissues (rs = -0.639, P < 0.001); (D) Spearman Correlation analysis clearly showed a negative correlation between miR-149 and AKT1 protein expression in HCC tissues (rs = -0.716, P < 0.001); (E and F) Relative expression of miR-149 and AKT1 mRNA HCC (HepG2) and normal liver (HL-7702) cells.
