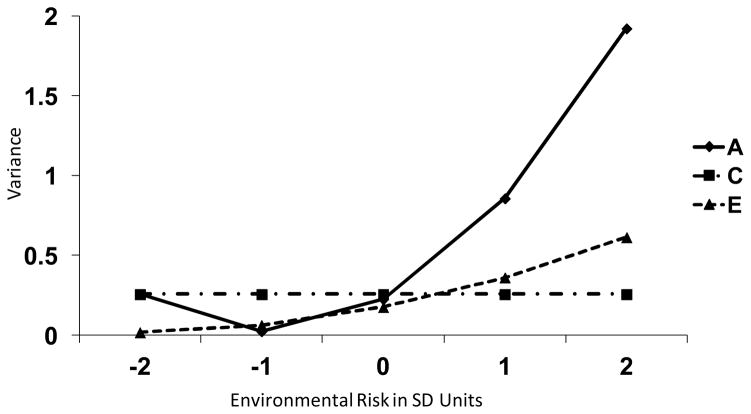
Figure 1. Gene-Environment Interaction: Genetic Variance in Adolescent Externalizing Disorders Varies as a Function of Environmental Risk.
This figure represents the overall pattern of findings described in Hicks et al. [35]. A = additive genetic influence, C = shared environmental influences, E = nonshared environmental influences, SD = Standard Deviation. Environmental risk was evaluated in terms of mother- and father-child relationship problems, antisocial and prosocial peer affiliation, academic achievement and engagement, and a composite of stressful life events (e.g., parental divorce). Across all environmental risk measures, genetic variance of adolescent externalizing disorders was greater in the context of greater environmental risk, and lower in the context of more protective environments. This figure shows findings in the aggregate across environmental risk measures.

