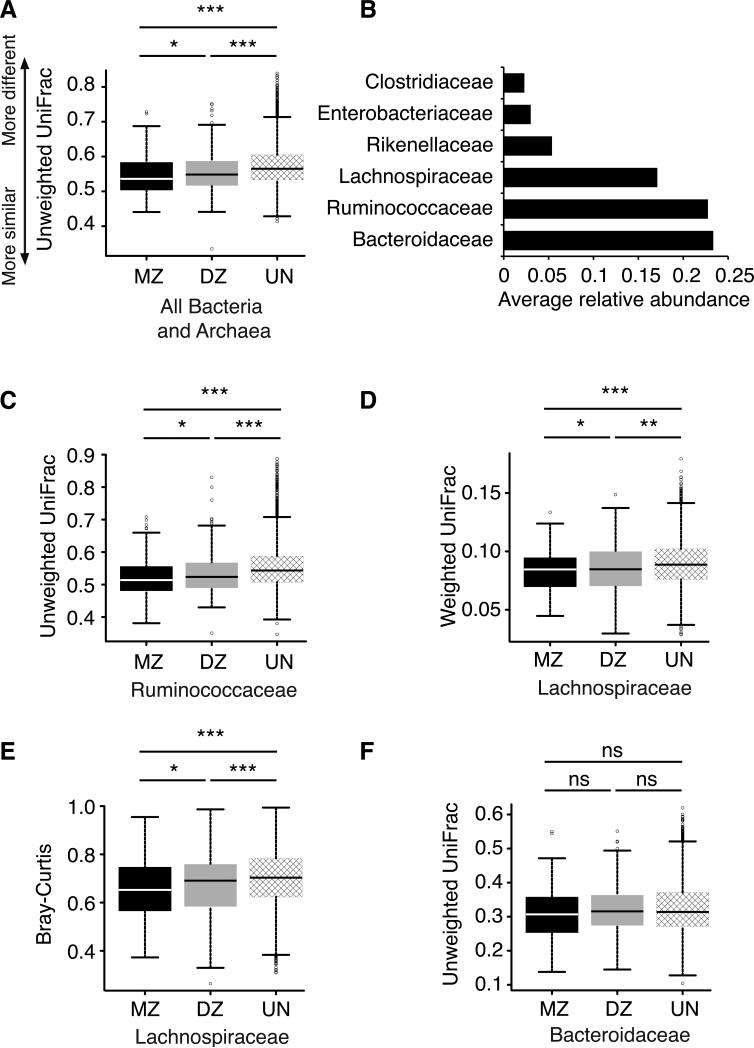
Figure 1. Microbiomes are more similar for monozygotic than dizygotic twins.
A, C-F: Box plots of beta-diversity distances between microbial communities obtained when comparing individuals within twinships for monozygotic (MZ) twin pairs and dizygotic (DZ) twin pairs, and between unrelated individuals (UN). A: the whole microbiome; C: the bacterial family Ruminococcaceae; D-E: the bacterial family Lachnospiraceae; F: the family Bacteroidaceae. The specific distance metric used in each analysis is indicated on the axes. *P<0.05, **P<0.01, ***P<0.001 for Student's t-tests with 1,000 Monte Carlo simulations. B: The average relative abundances in the whole dataset for the top six most prevalent bacterial families (unrarefied data, see Methods). Relates to Figure S1 and Table S1.

