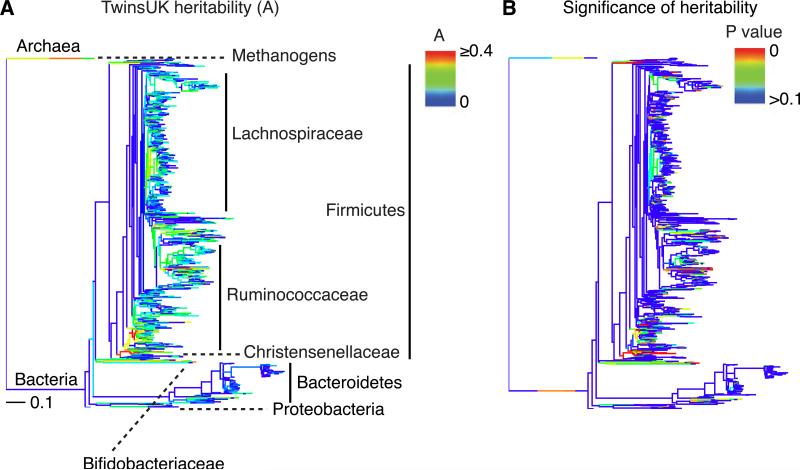
Figure 3. Heritability of microbiota in the TwinsUK dataset.
A: OTU Heritability (A from ACE model) estimates mapped onto a microbial phylogeny and displayed using a rainbow gradient from blue (A = 0) to red (A ≥ 0.4). This phylogenetic tree was obtained from the Greengenes database and pruned to include only nodes for which at least 50% of the TwinsUK participants were represented. B: The significance for the heritability values shown in A was determined using a permutation test (n=1,000) and are shown on the same phylogeny as in panel A. P values range from 0 (red) to >0.1 (blue). Relates to Figure S3 and Table S2.

