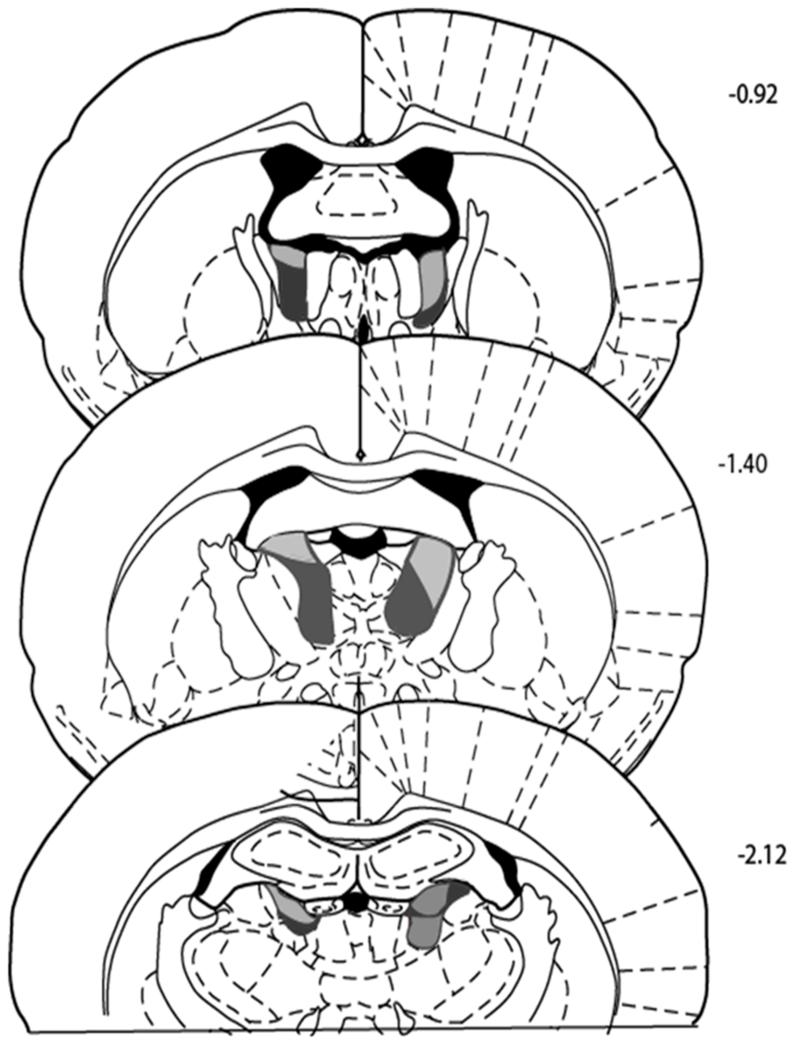
Figure 1.
Coronal sections depicting the cases with the smallest (gray) and largest (black) of the anterior thalamic nuclei lesions. The numbers refer to the approximate distance of the section in mm caudal to bregma. Sections are based on The Rat Brain in Stereotaxic Coordinates, by G. Paxinos and C. Watson, San Diego, CA: Academic Press. (2005). Reproduced with permission from Elsevier.

