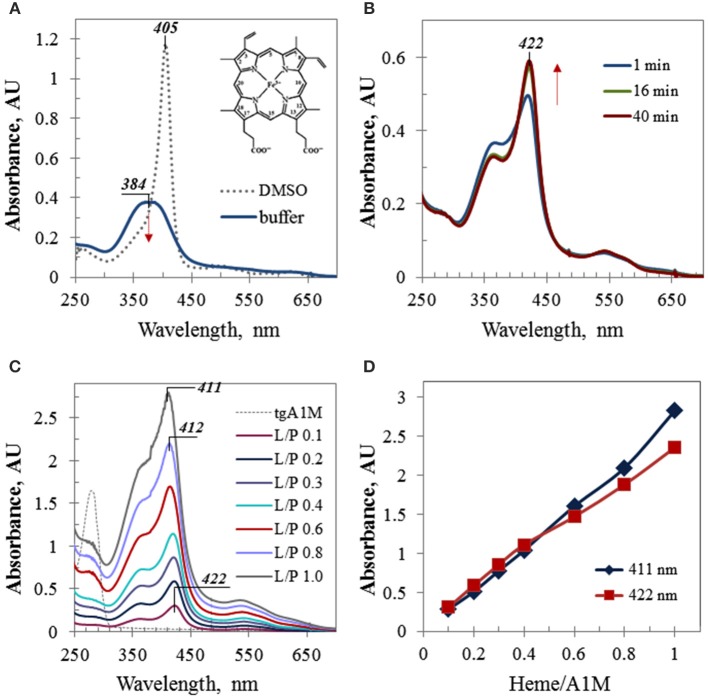
Figure 1.
UV/Vis electronic absorbance data. (A) UV/Vis spectra of heme in Tris buffer and DMSO; the same aliquot of 1.28 mM heme stock solution was added to 1 mL of buffer or DMSO, respectively; inset shows heme structure; (B) time-course absorbance spectra of 45 μM A1M sample containing 0.1 molar equivalent of heme (L/P 0.1); (C) differential UV/Vis spectra of the A1M titration by heme (the initial spectrum of 45 μM A1M, shown by thin dotted trace, has been subtracted by running the A1M sample as a blank prior to adding heme); the spectra are shown for the time point 40 min; all titration samples were measured in 10 mm pathlength cuvette, except the last one (L/P 1.0) which spectrum has been recorded in 5 mm pathlength cuvette and then normalized to 10 mm path; (D) the absorbance intensities of the Soret band of heme complexes with A1M as plotted at the wavelengths 422 nm (λmax at low L/P) and 411 nm (λmax at higher L/P).

