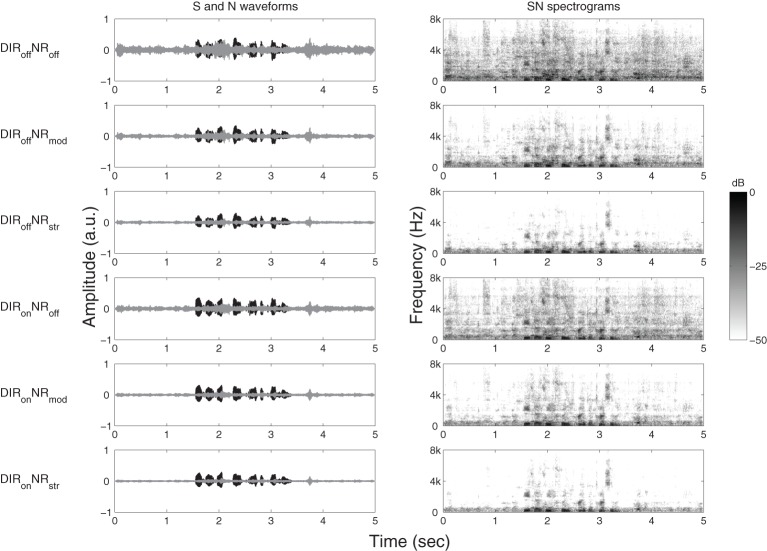
Figure 1.
Graphical illustration of the effects of DIRoffNRoff, DIRoffNRmod, DIRoffNRstr, DIRonNRoff, DIRonNRmod, and DIRonNRstr processing on (one channel of) an example stimulus with an input SNR of 4 dB. Panels on the left-hand side show time waveforms of the target speech, S (black) and the cafeteria noise, N (gray). Panels on the right-hand side show corresponding spectrograms for the signal mixtures, SN. a.u. denotes arbitrary units.

