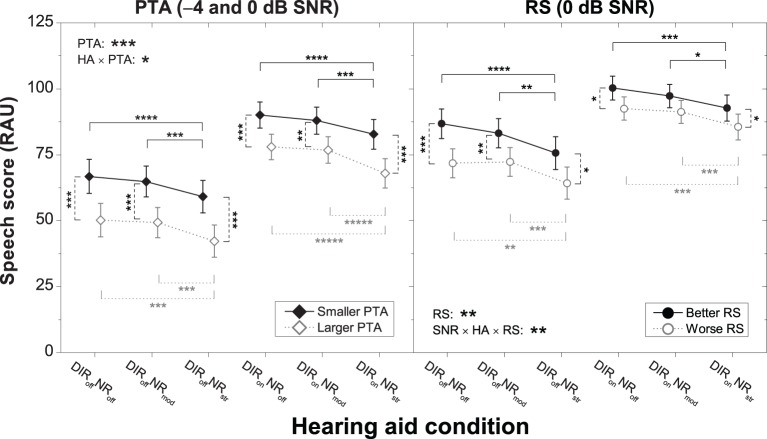
Figure 3.
Mean speech scores for the six HA conditions for the “smaller PTA” and “larger PTA” subgroups at −4 and 0 dB SNR (left panel) and the “better RS” and “worse RS” subgroups at 0 dB SNR (right panel). Error bars show 95% confidence intervals. Black solid horizontal bars denote significant differences for the “smaller PTA” and “better RS” subgroups, gray dotted horizontal bars denote significant differences for the “larger PTA” and “worse RS” subgroups, and black dashed vertical bars denote significant differences among pairs of subgroups for a given HA condition (*p < 0.05, **p < 0.01, ****p < 0.0001, *****p < 0.00001). HA denotes HA condition.

