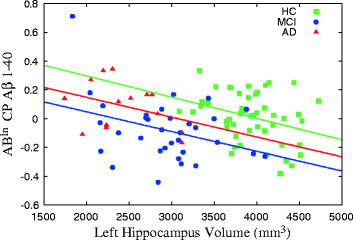
Figure 1.

Hippocampal volume versus amyloid regression. Graph shows results of linear regression analysis of the left hippocampal volume and amyloid-β (Aβ) levels of Aβln cellular pellet (CP) Aβ(1–40) in the healthy control (HC), minor cognitive impairment (MCI) and Alzheimer’s disease (AD) groups.
