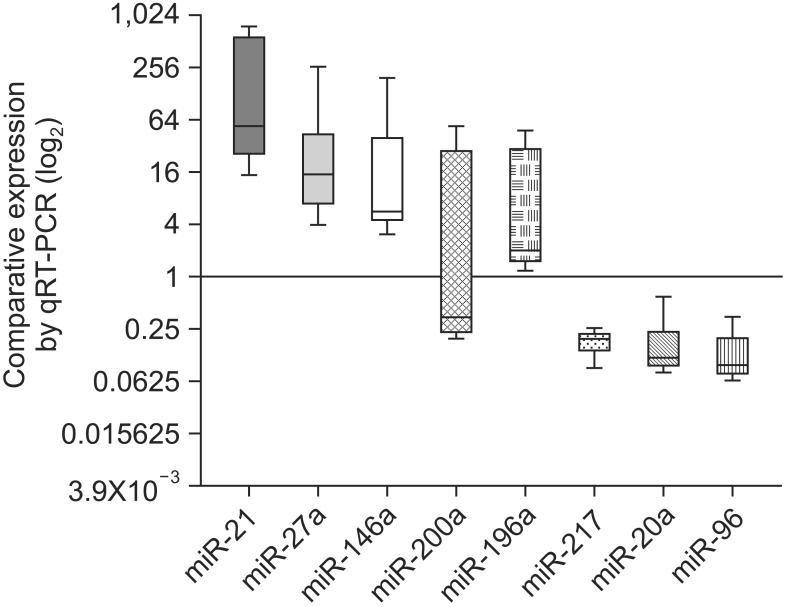
Fig. 3.
Box plot showing the overall expression levels of eight species of microRNAs (miRNAs) as revealed by quantitative RT-PCR (qRT-PCR) in 11 fine-needle aspiration specimens from cancer compared to control tissue. The expression levels in control paraneoplastic normal pancreatic tissues were set to 1.0 in terms of log2 values.

