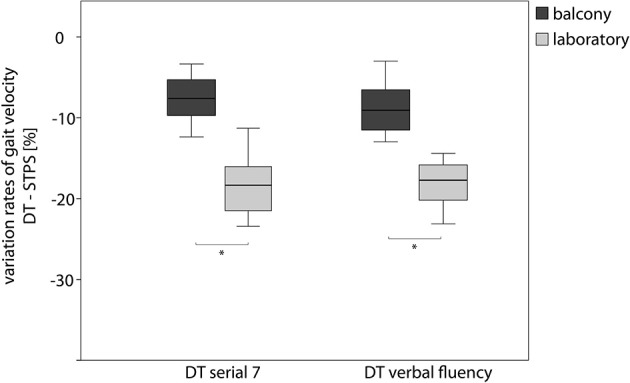
Figure 3.

Effect of a cognitive loading on the gait velocity during walking on the balcony and in the laboratory. Boxplot graph of the individual Variation Rates (percentage of decrease) for gait speed during walking and performing a Serial 7 Dual Task and walking and performing a Verbal Fluency Dual Task. Dark gray boxplots represent the Dual Task costs on the balcony, light gray in the basement laboratory. DT, Dual Task; STPS, Single Task walking with preferred speed. *indicates p < 0.05.
