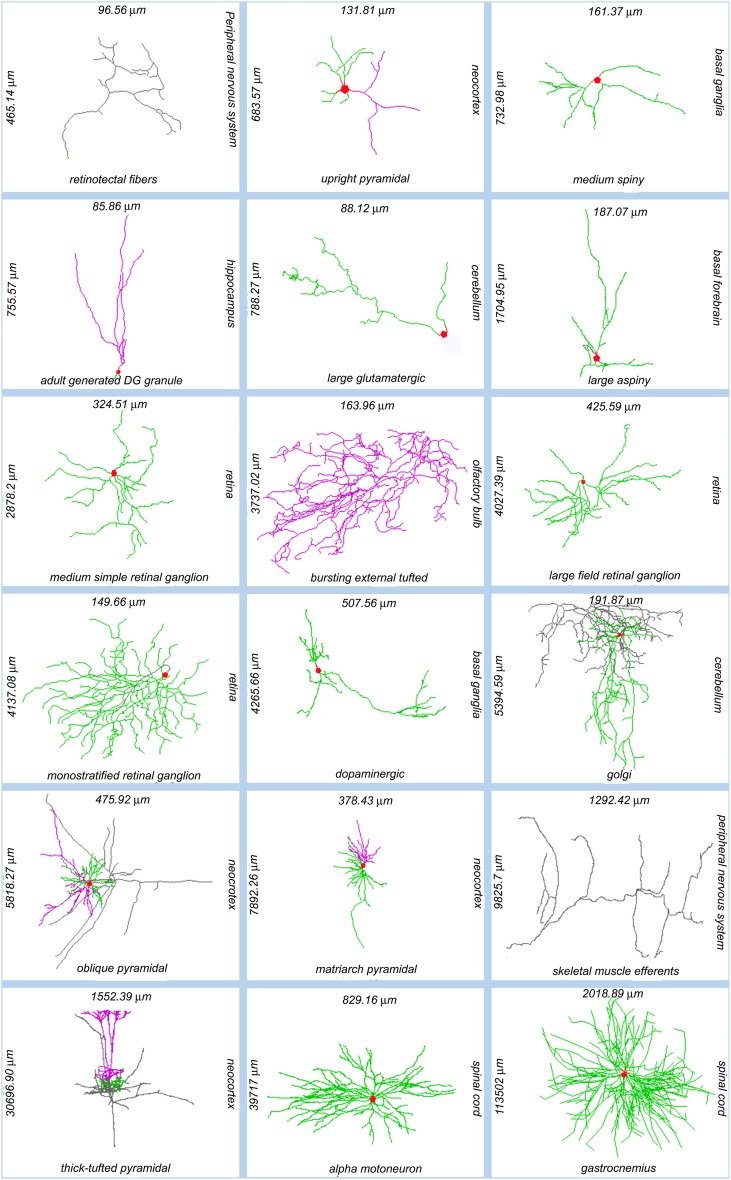
Figure 1.
Sample of NeuroMorpho.Org reconstructions representing the anatomical diversity of dendritic and axonal trees. Each image is labeled (clockwise from its right side) with the somatic brain region, neuron types, total arbor length, and arbor width. Somata: red; axons: gray; (basal) dendrites: green; apical dendrites: magenta. NeuroMorpho.Org IDs of these neurons from left to right: 06787, 04183, 04457, 06312, 05713, 04477, 00779, 06216, 00777, 05491, 00888, 06904, 06141, 06295, 07707, 07763, 00690, 00606.

