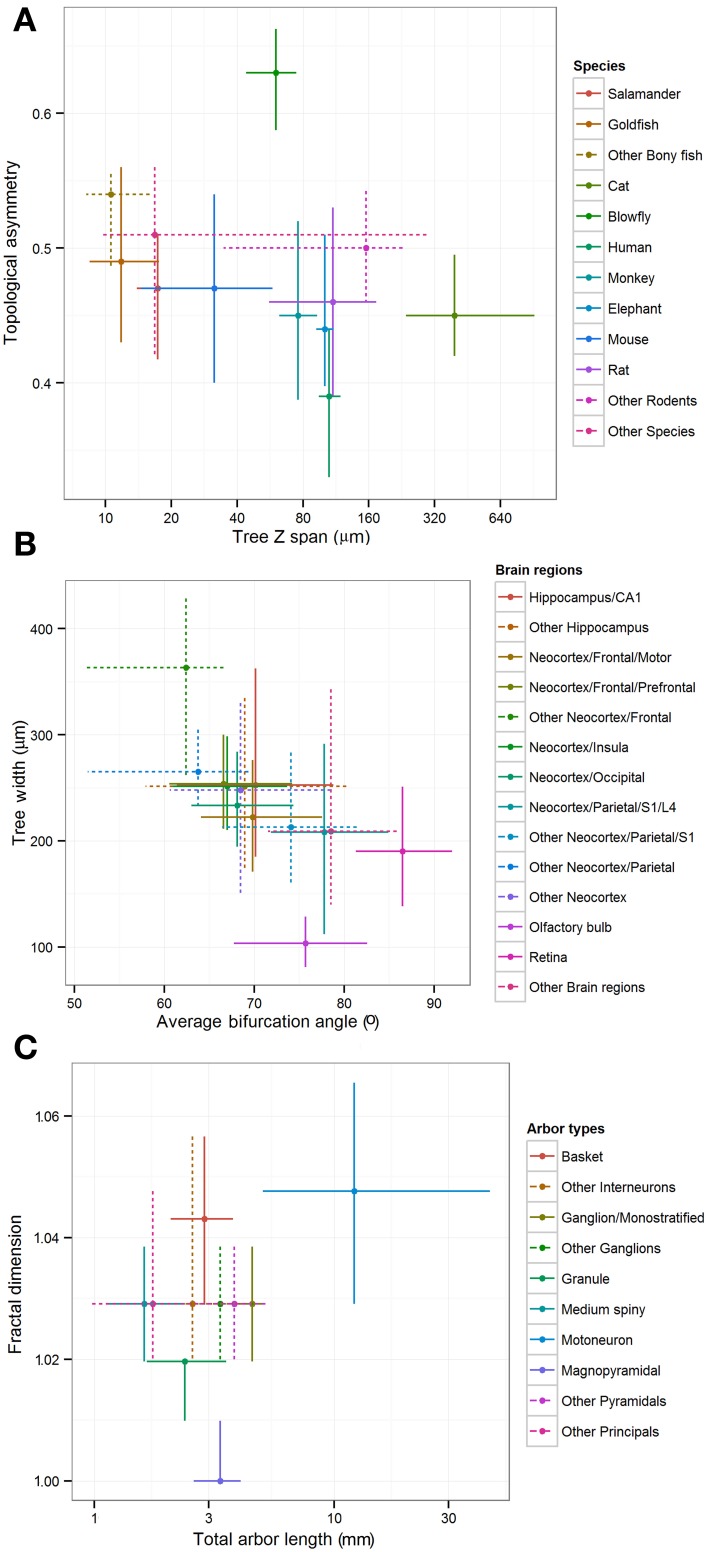
Figure 4.
Inter-group differences of representative morphometric features within each main metadata dimension. Crosshairs represent medians and quartile ranges of each group corresponding to the leaf nodes in the hierarchies shown in Figure 3. Dotted lines indicate “other” groups with merged data. (A) Differences in arbor depth and topological asymmetry among species. (B) Differences in arbor width and average bifurcation angle among brain regions. (C) Differences in fractal dimension and total arbor length among cell types.

