
Figure 4.
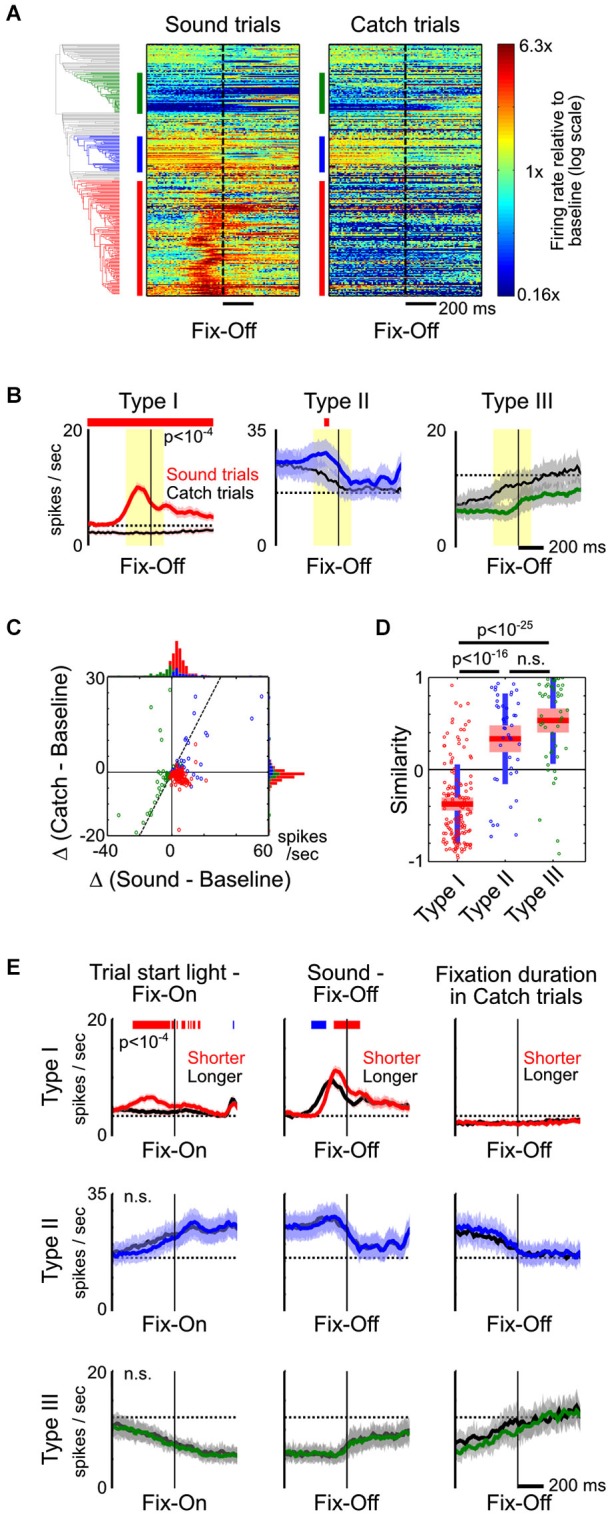
Type-II and III BF neurons reflect fixation and movement states. (A) PSTHs of all individual BF neurons to fixation port exit (Fix-Off) in sound trials and catch trials, with response amplitude normalized by their respective baseline firing rates. While the response of Type-I BF neurons were the opposite in sound and catch trials, the responses of other neurons were highly similar when animals exited the fixation port, irrespective of whether the exit response was prompted by a stimulus. (B) The average PSTHs of the three types of BF neurons relative to fixation port exit response, in sound trials (colored) and catch trials (black). Significant response modulations between the two trial types are indicated by the red line (paired t-tests, p < 10−4). (C) Scatter plot of the response amplitude of individual BF neurons in sound vs. catch trials, calculated at the [−200,100] ms window relative to fixation exit (yellow shaded area in B). Many Type-II and III neurons had similar response amplitudes in both trial types and fell along the unity line (dashed line), while Type-I neurons were in the opposite quadrants. (D) Similarity of fixation port exit response temporal profiles between the two trial types (ANOVA, F(2,232) = 94.1, p < 10−29, post hoc t-tests). (E) The average PSTHs of the three types of BF neurons aligned to fixation port entry (left) or exit (middle and right), for trials with shorter (colored) or longer (black) response latencies. The respective response latencies are indicated above each column. Significant response differences between shorter and longer latency trials are indicated by the red/blue line (paired t-tests, p < 10−4).