Figure 5.

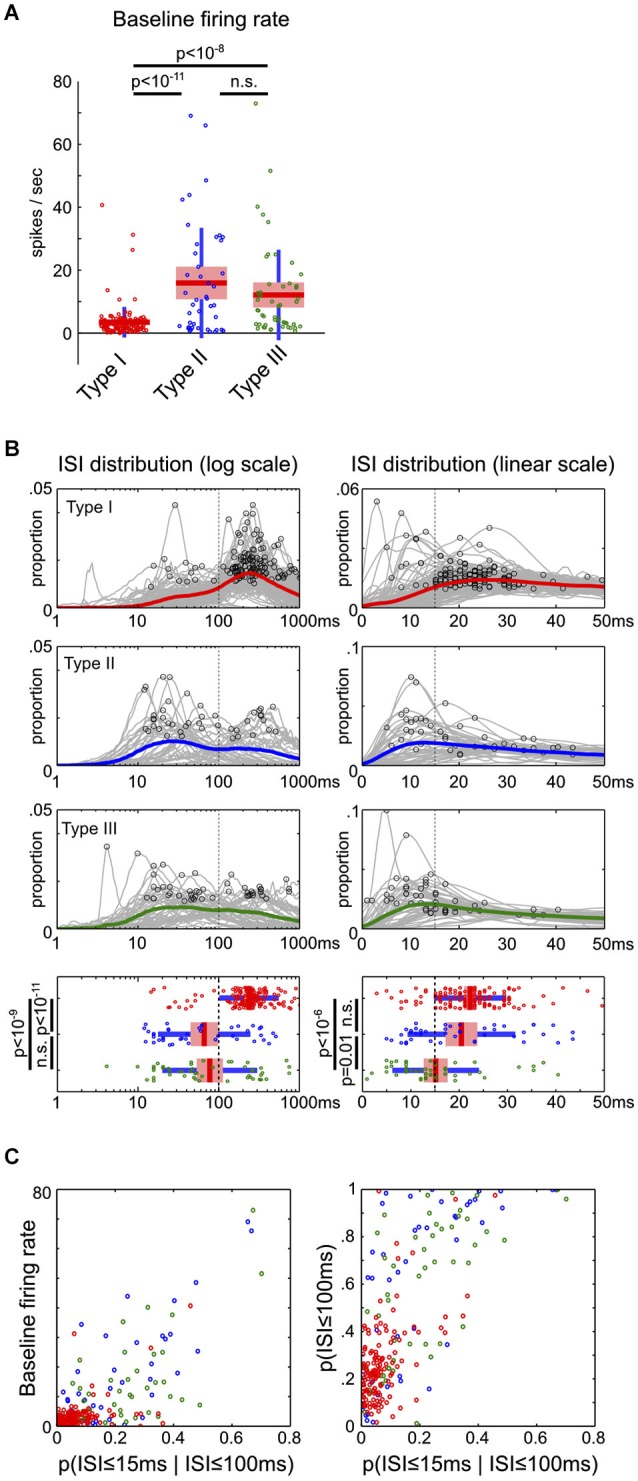
Firing rate and inter-spike interval characteristics of BF neuronal types. (A) The baseline firing rates of Type-II and III neurons were significantly higher than Type-I BF neurons (ANOVA, post hoc t-tests). (B) ISI distributions on both log and linear scales for the three types of BF neurons. The mean ISI distributions for each type of neurons are shown in colored lines, with the peak of individual ISI distributions indicated by black circles. Significant differences in the peak of ISI distributions were found between the three types of neurons (ANOVA, log scale, F(2,232) = 35.27, p < 10−13; linear scale, F(2,232) = 12.74, p < 10−5, post hoc t-tests). Type-I BF neurons showed two distinct peaks in the ISI distributions: 200–300 ms on the overall log scale ISI distribution, and 15–30 ms on the zoomed-in linear scale ISI distribution. Vertical dashed lines indicate the boundaries used to separate the three types of BF neurons. (C) Scatter plots between baseline firing rates and ISI distribution features. Type-I neurons are reliably discriminated from Type-II and III neurons based only on firing rate and ISI features. In addition to low baseline firing rates, Type-I BF neurons had lower proportions of short ISIs, generally with p(ISI ≤ 100 ms) less than 0.4, and p(ISI ≤ 15 ms | ISI ≤ 100 ms) less than 0.15.
