Figure 6.
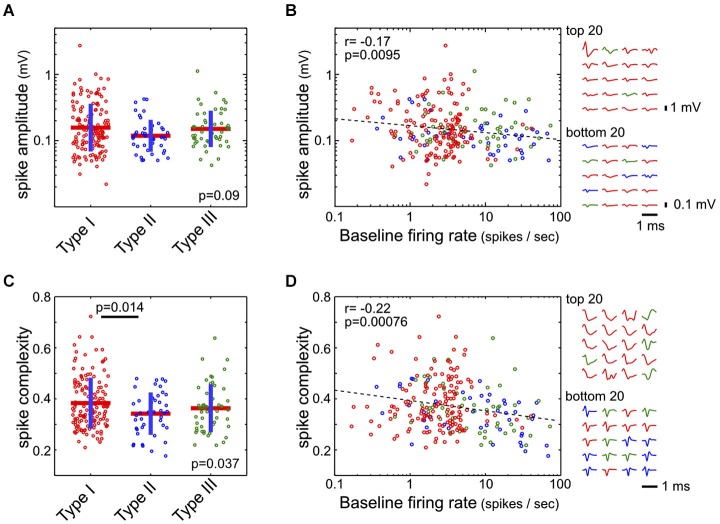
Spike amplitude and complexity in the three types of BF neurons. (A) Spike amplitudes were not statistically different between the three types of BF neurons (ANOVA, F(2,232) = 2.43, p = 0.09). (B) However, spike amplitude was negatively correlated with the baseline firing rate (Pearson correlation, r = −0.17). Spike waveforms for the BF neurons with highest and lowest amplitudes are shown on the right, with different amplitude scale bars. (C) Spike complexity, defined as the mean absolute amplitude of the peak normalized waveform, was higher in Type-I than in Type-II neurons (ANOVA, F(2,232) = 3.36, p = 0.037; significant post hoc t-test indicated). (D) Spike complexity showed a stronger dependency with baseline firing rate (Pearson correlation, r = −0.22). Normalized spike waveforms for the 20 BF neurons with the most and least complex spike waveforms are shown on the right.

